2024 Q3 Real Estate Statistics

2024 Q3 Real Estate Statistics

This year brings unique circumstances with the election year. Agent April Womack, notes that “election years are notoriously slower in real estate as buyers and sellers both prefer to see what a new guard may bring in.” Ben Morton, agrees that “real estate seems to be holding out for the election.” With this in mind, Spring may bring more activity than we’ve seen in the past several months.   

In spite of election year hesitancies, “activity does seem to be picking up in pendings and solds although we still are experiencing a record number of listings” according to Julia Mistler. Property is still moving with buyers and sellers still leaving the closing table feeling satisfied. Being that the market has stabilized from the past several years of tumultuous change, the name of the game will be finding “where our homes and their values fit into the current market, rather than the previous one” (April Womack). 

Looking forward, there is optimism; at the September 2024 Fed meeting, interest rates were cut by 50 basis points. While this isn’t a significant drop, it is the first rate decline since 2020 - giving buyers and sellers alike some welcome relief. 

For more insights on the market and what’s happening in your area, reach out today!
Suburban neighborhood of two-story homes along a curved, landscaped street beneath leafy trees.

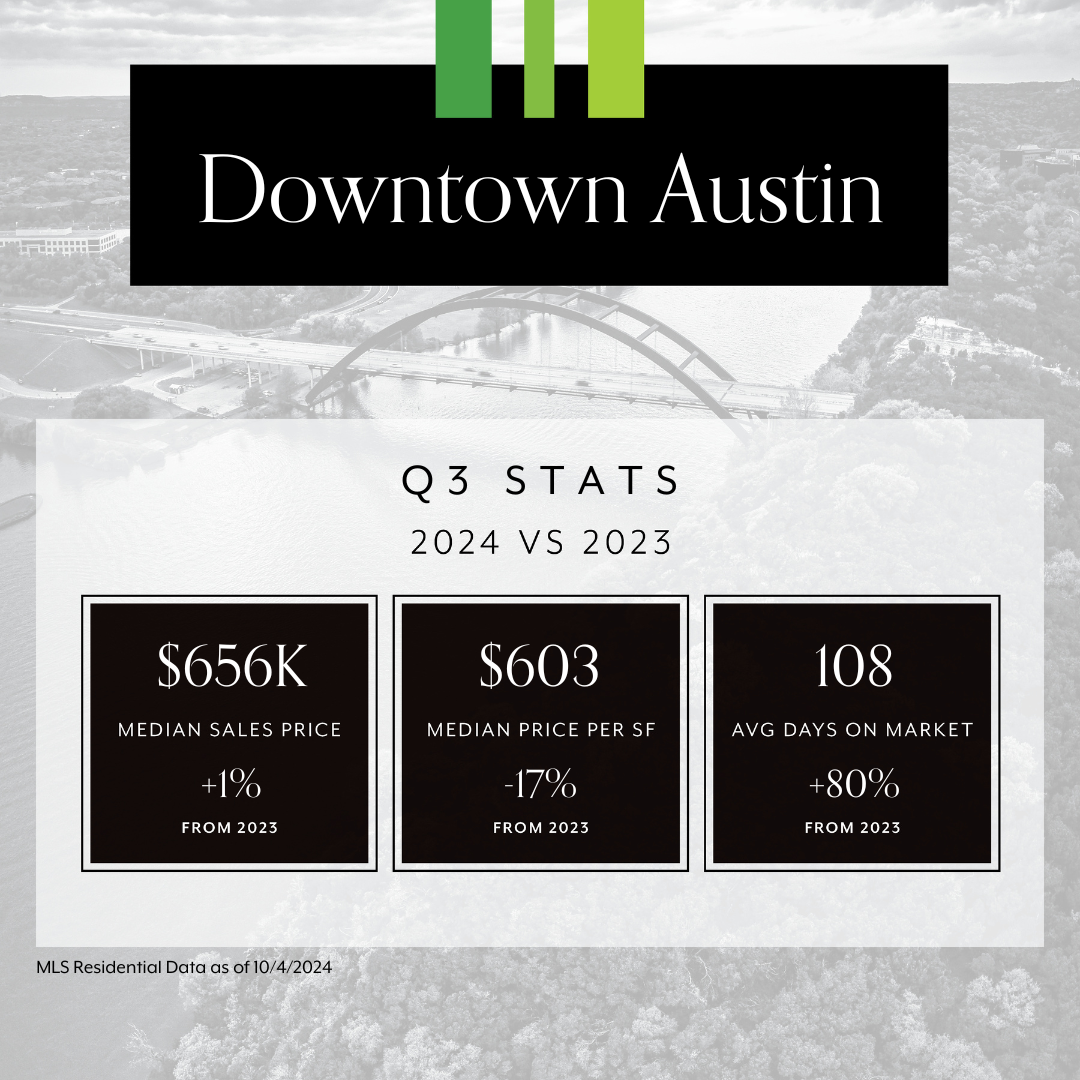
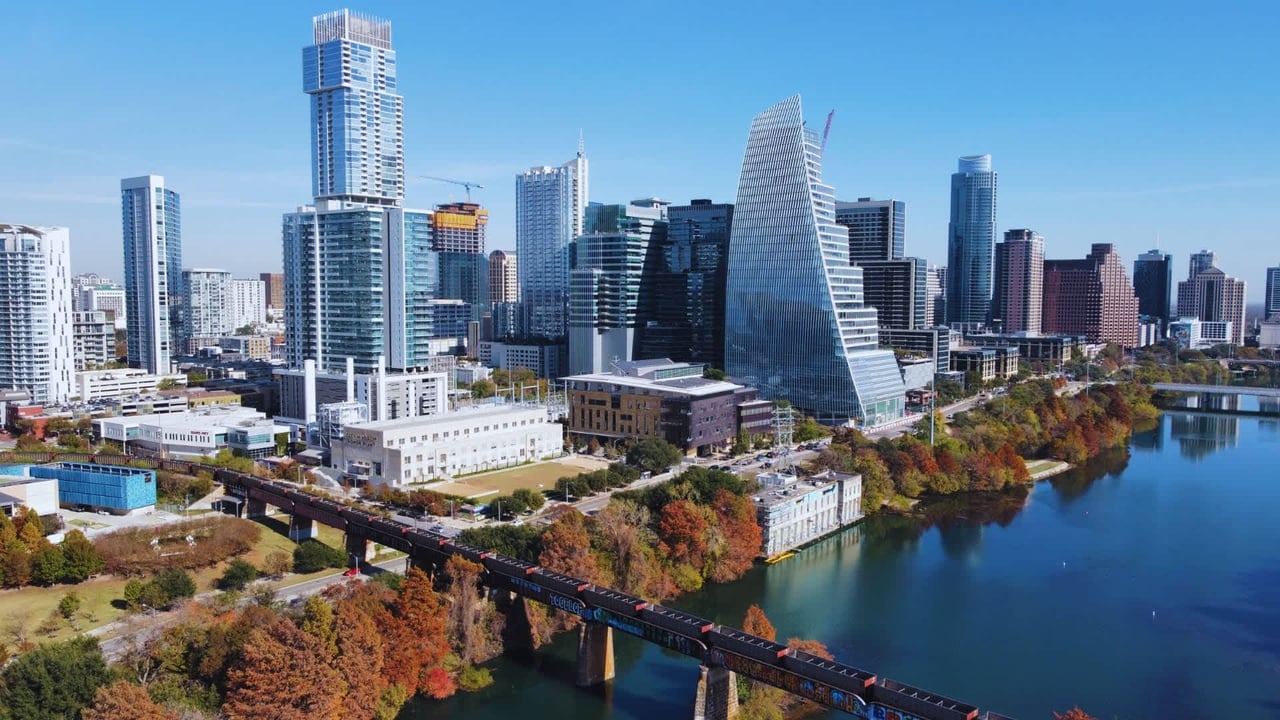
Downtown Austin Q3 2024 real estate statistics compared with 2023: prices and average days on market.

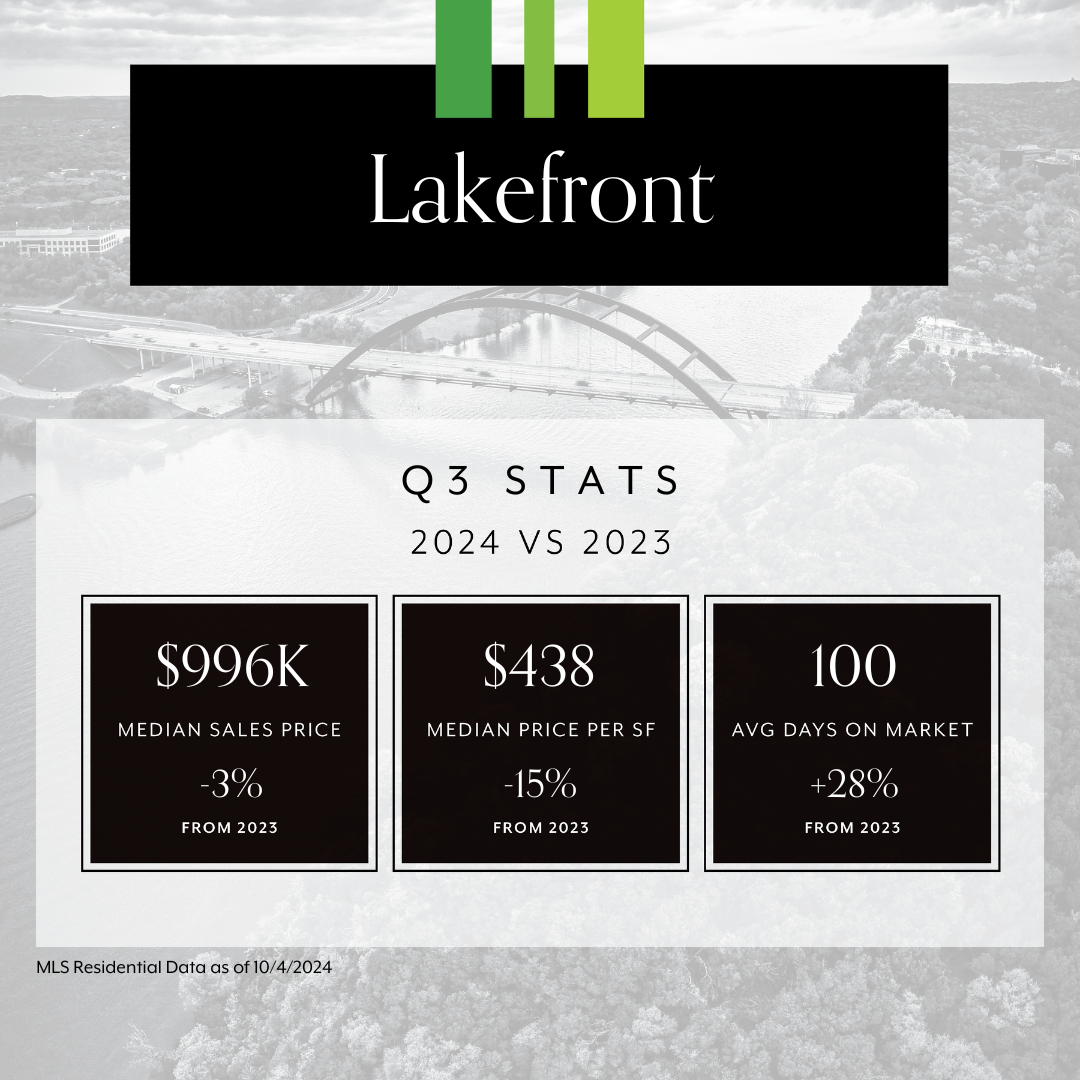
Lakefront Q3 2024 statistics: $996K median sales price, $438 per square foot, and 100 average days on market.

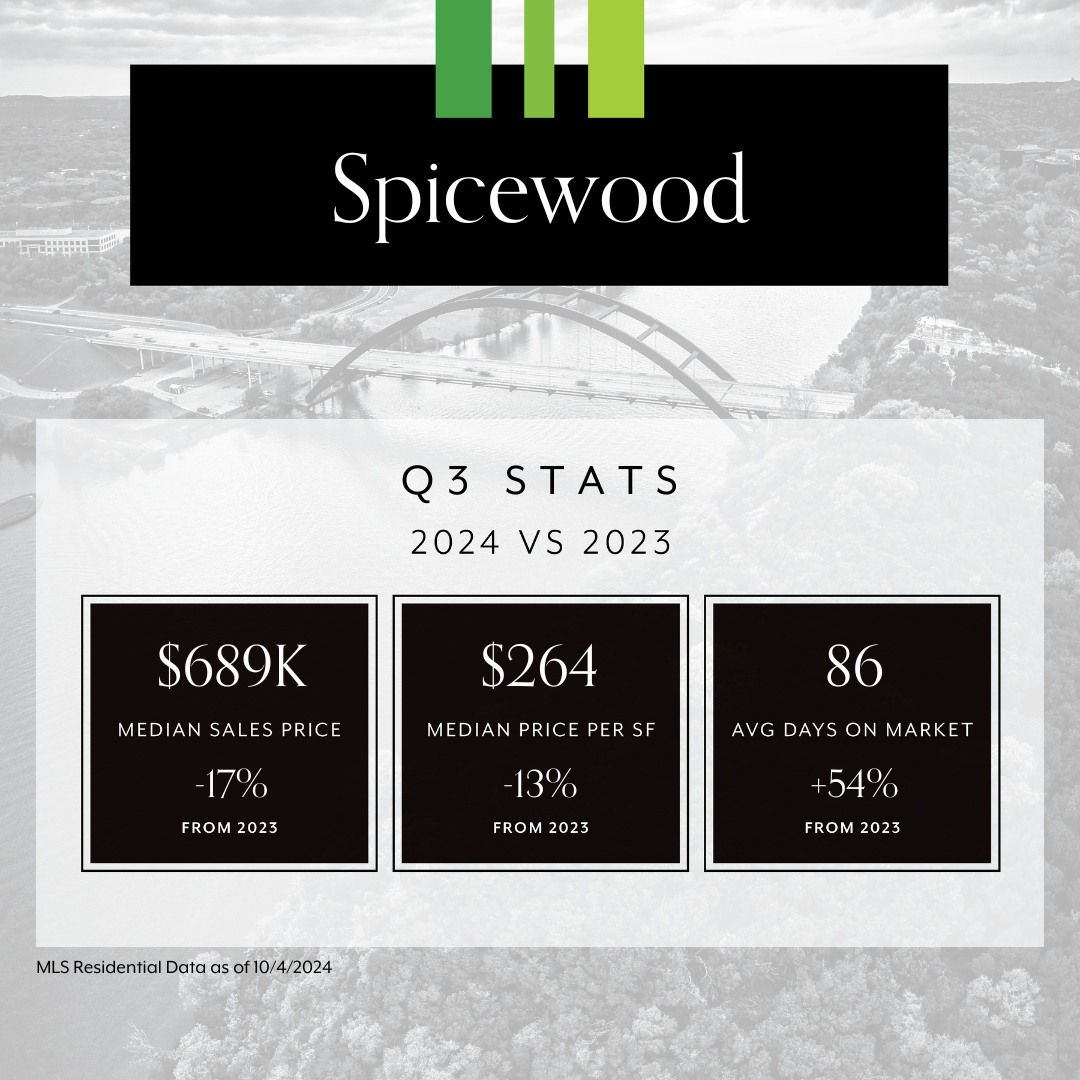
Spicewood Q3 2024 real estate statistics compared with 2023: prices fell, while average days on market rose.

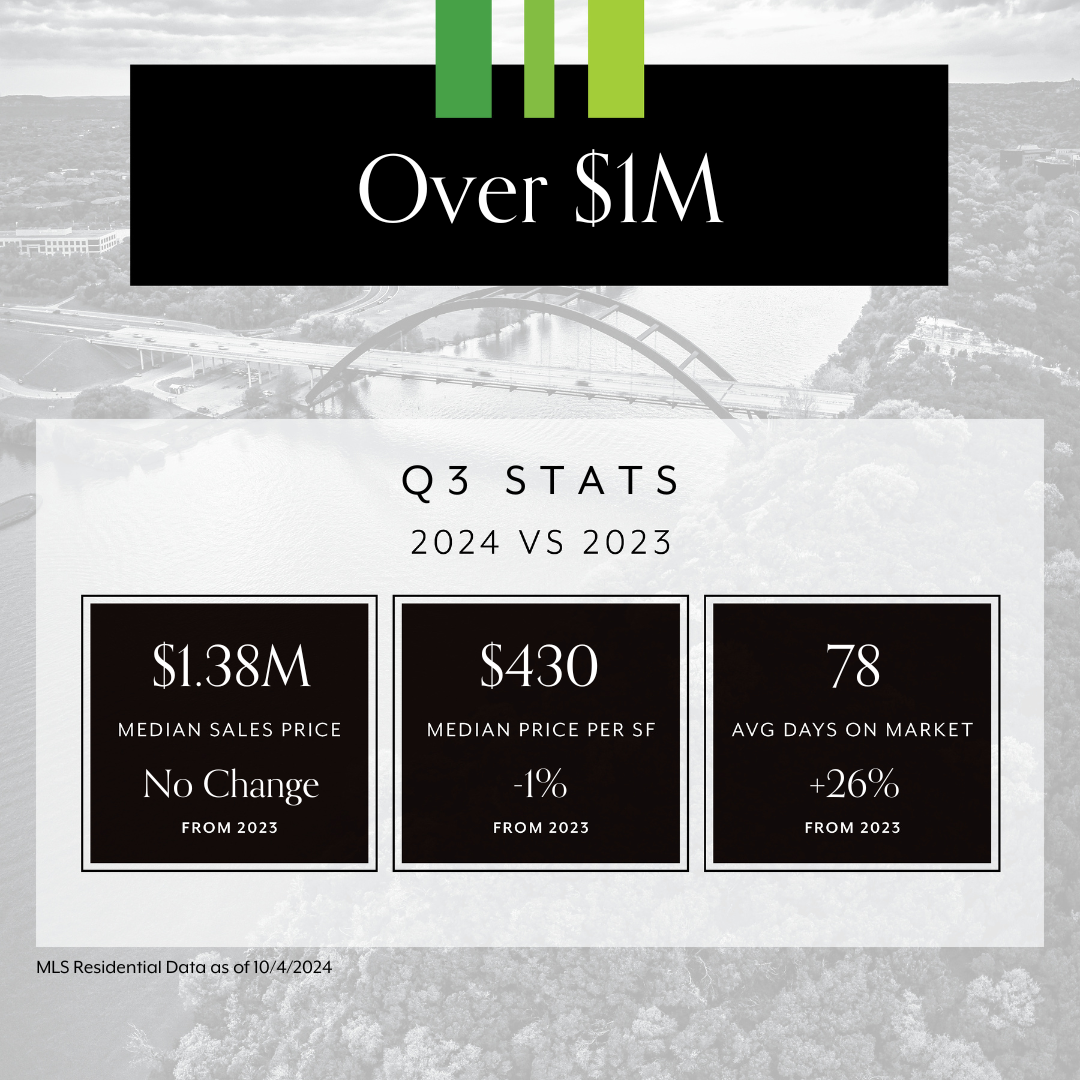
Q3 2024 real estate statistics infographic comparing median price, price per square foot, and days on market.

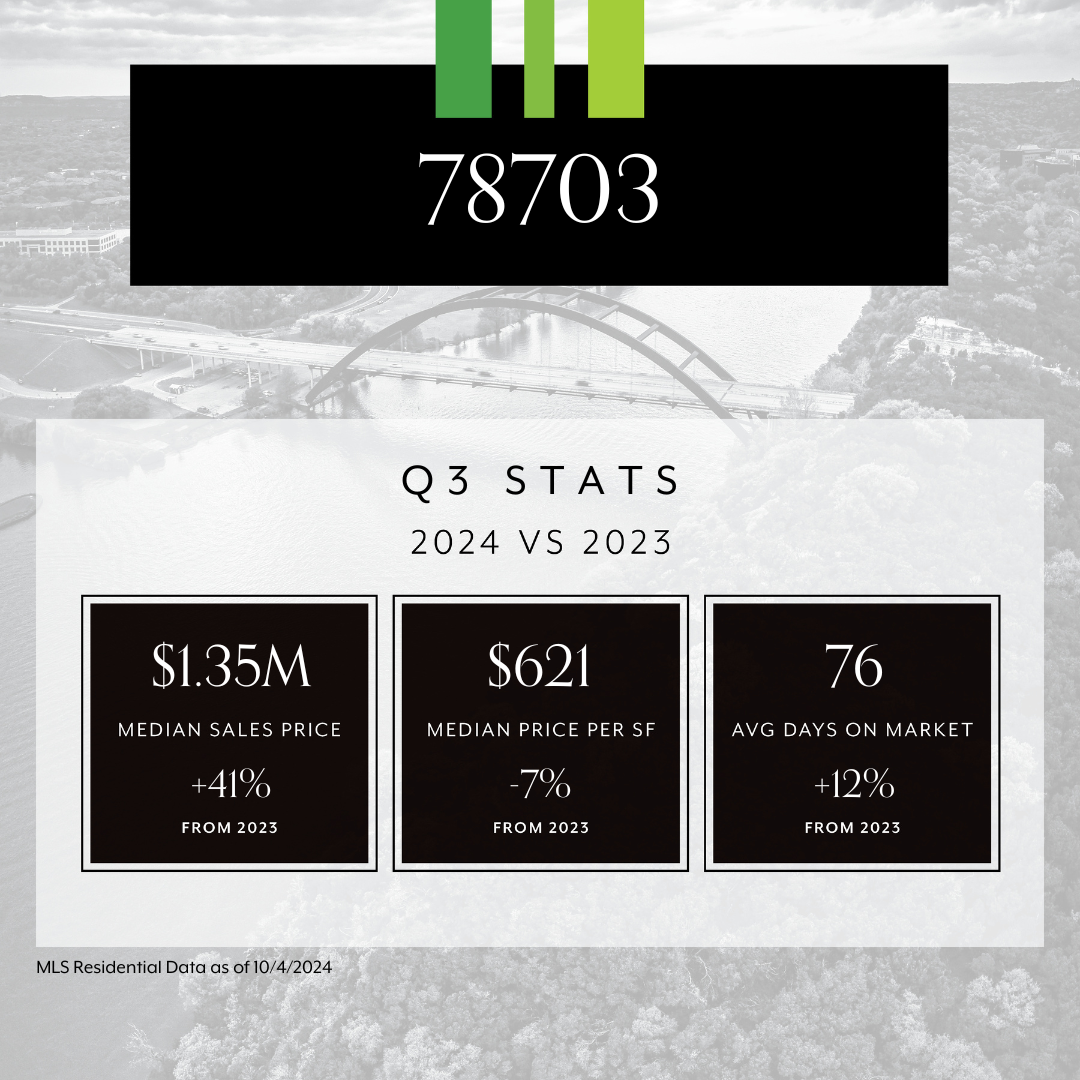
78703 Q3 real estate statistics: median price $1.35M, price per square foot $621, and 76 average days on market.

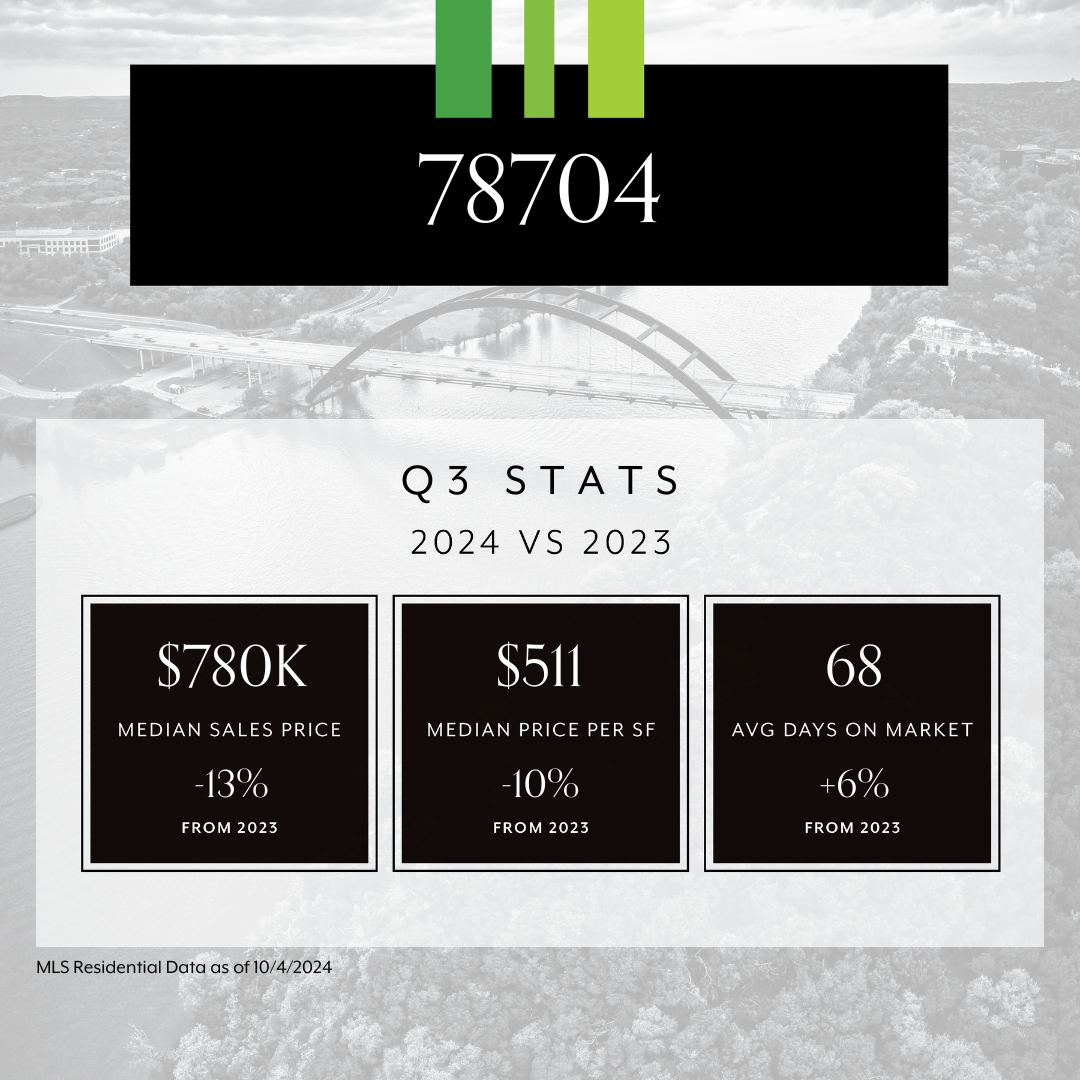
Q3 2024 real estate statistics for ZIP code 78704 compared with 2023.

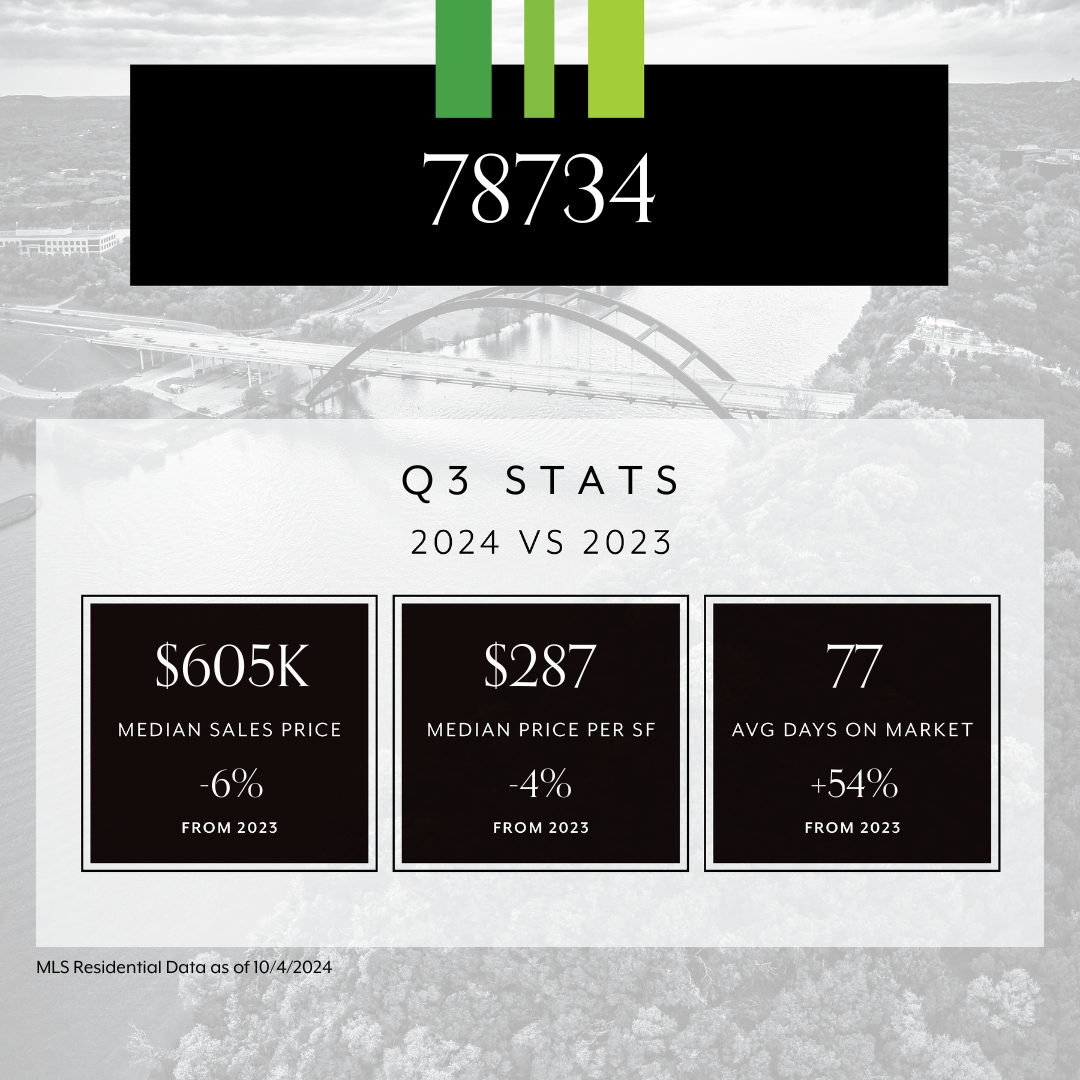
78734 Q3 2024 real estate statistics compared with 2023: prices down and average days on market up.

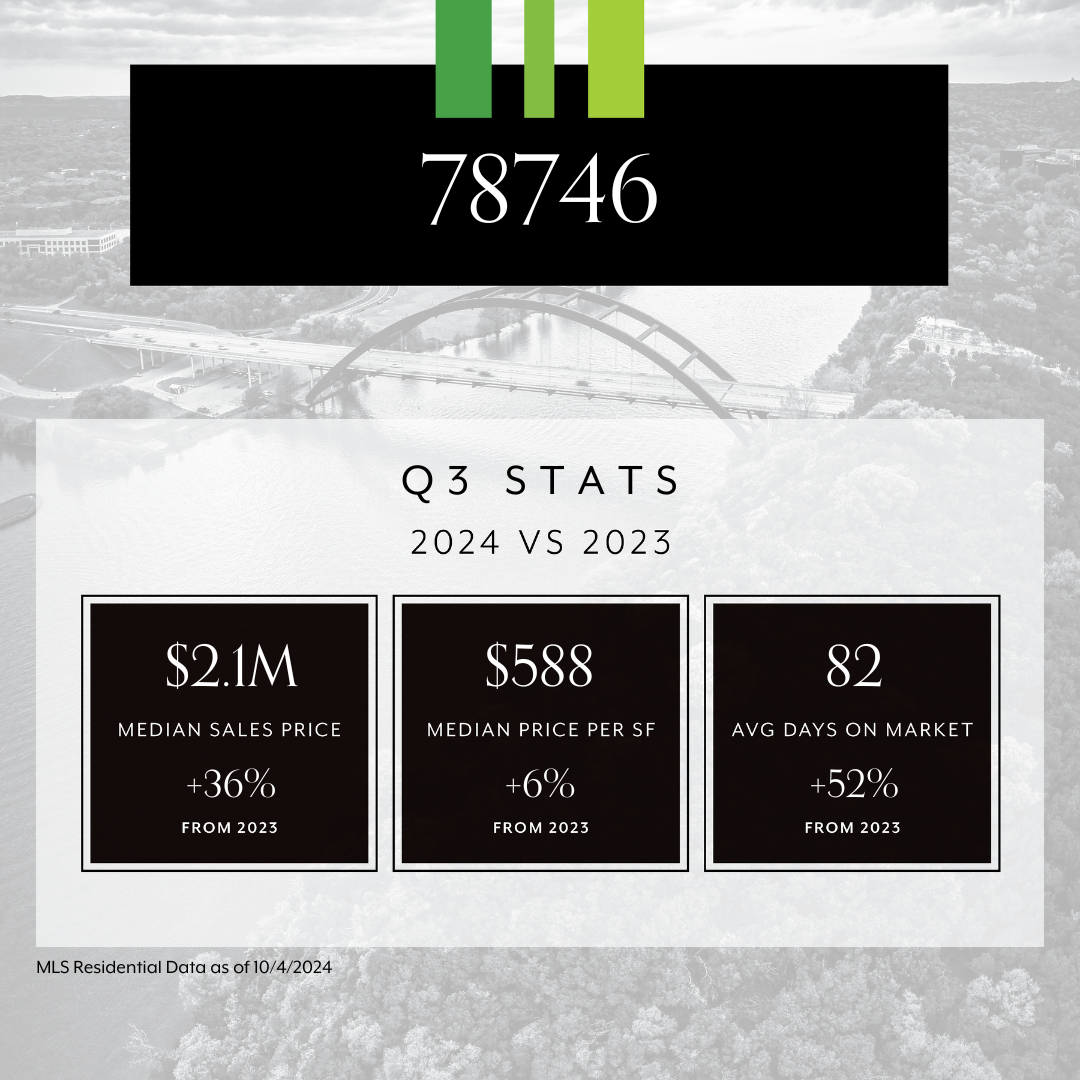
78746 Q3 real estate statistics comparing 2024 with 2023: median sales price, price per square foot, and days on market.

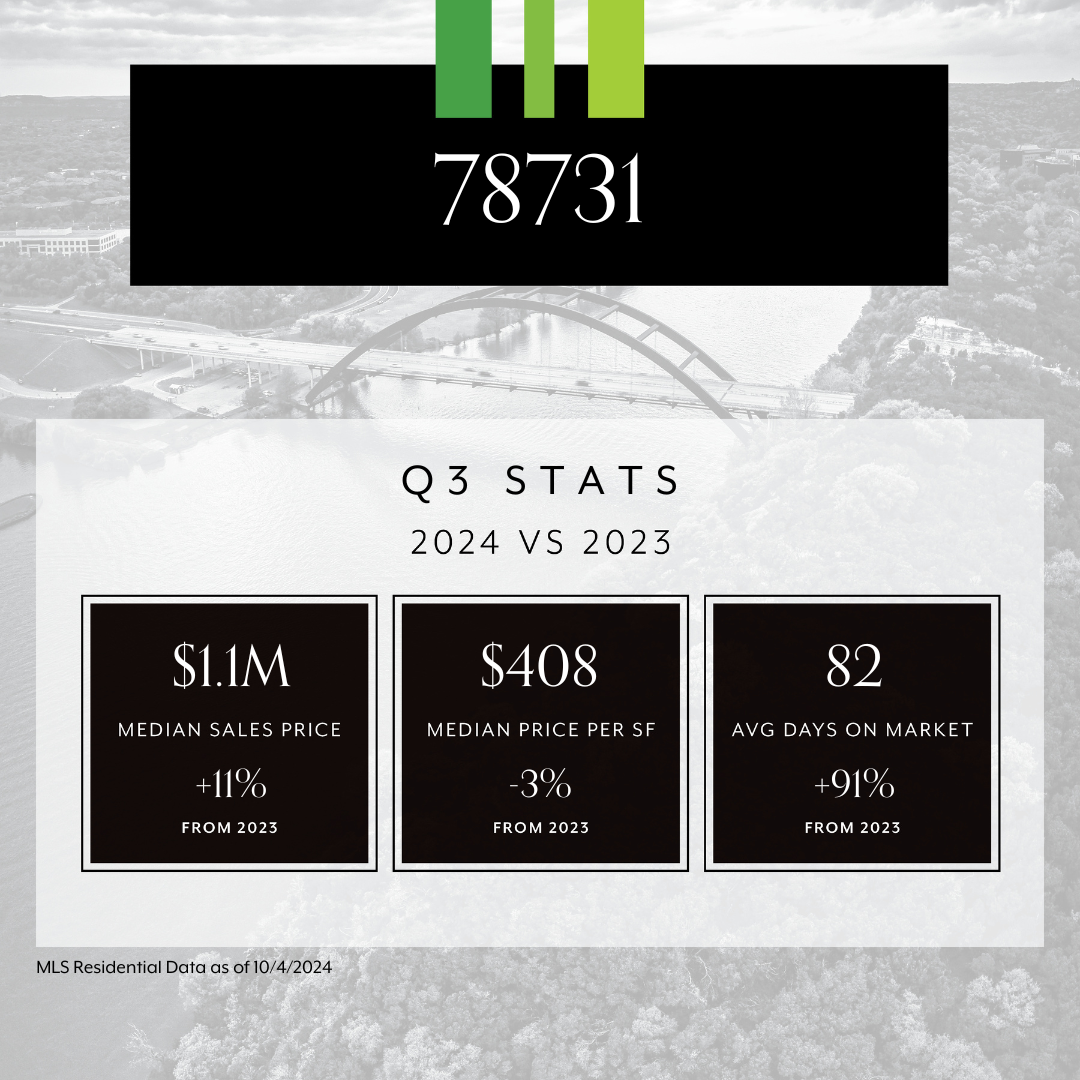
78731 Q3 2024 stats: $1.1M median sales price, $408 per square foot, and 82 average days on market.

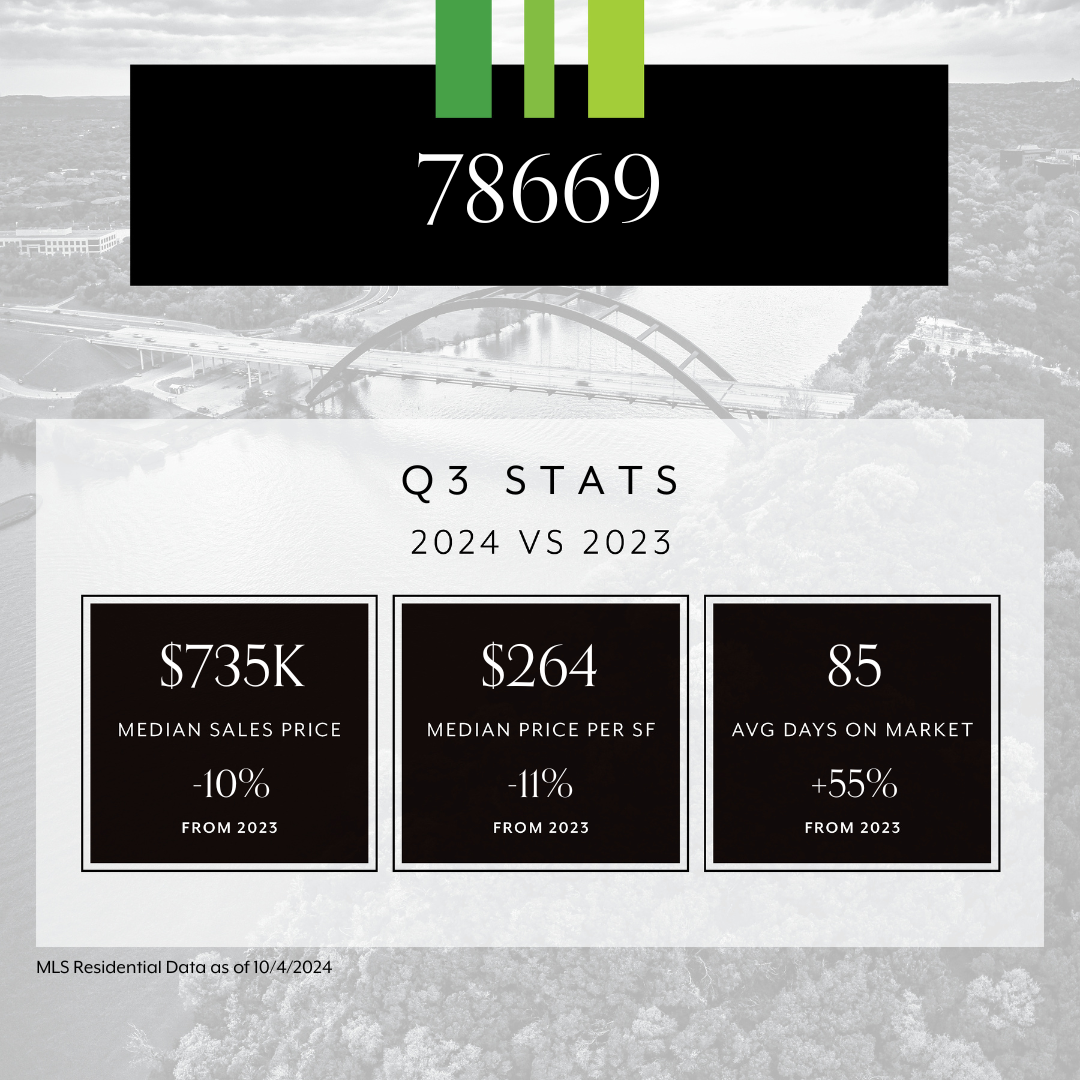
Q3 2024 real estate stats for 78669: $735K median price, $264 per square foot, and 85 average days on market.

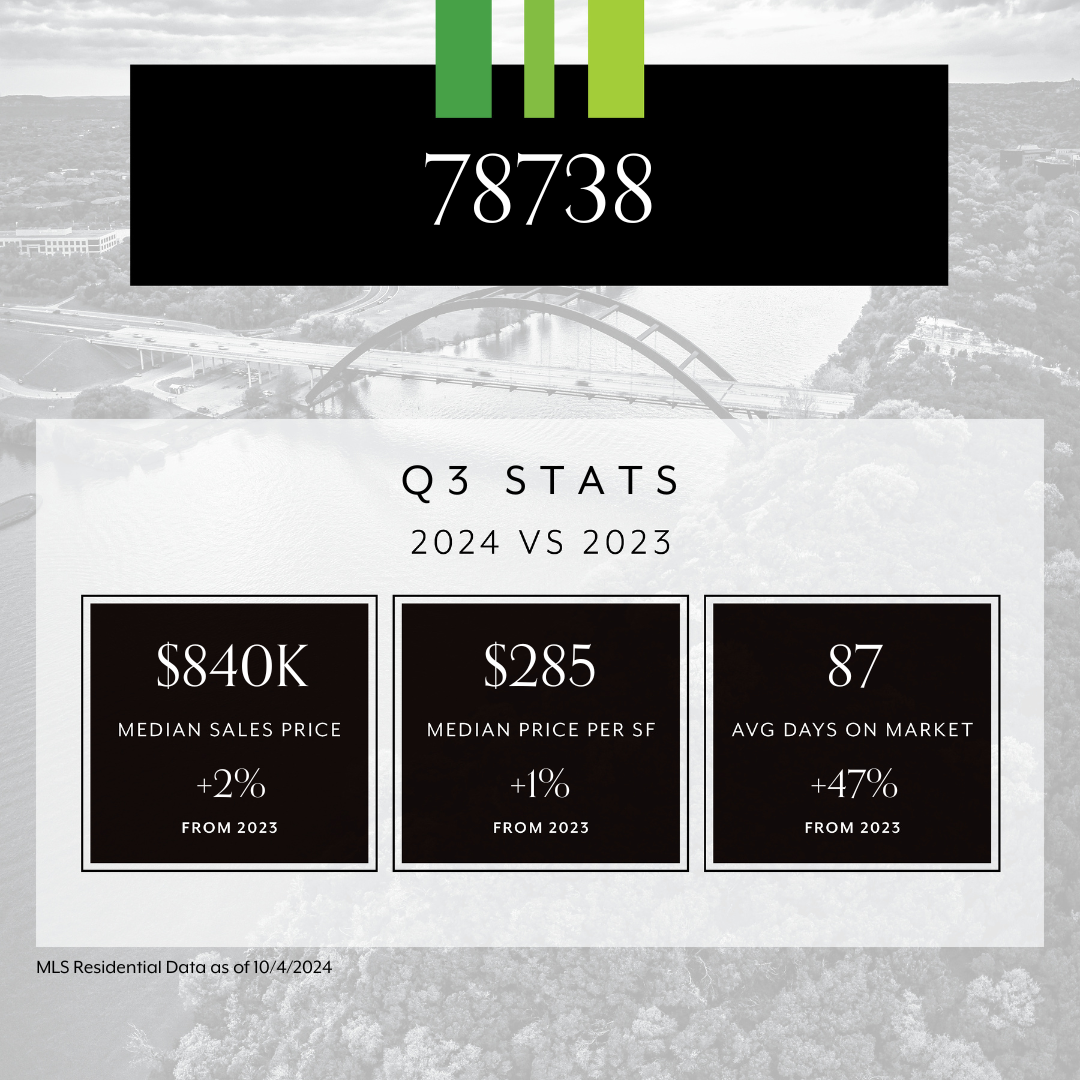
Q3 2024 real estate statistics for ZIP code 78738, with three market metrics over an aerial bridge view.

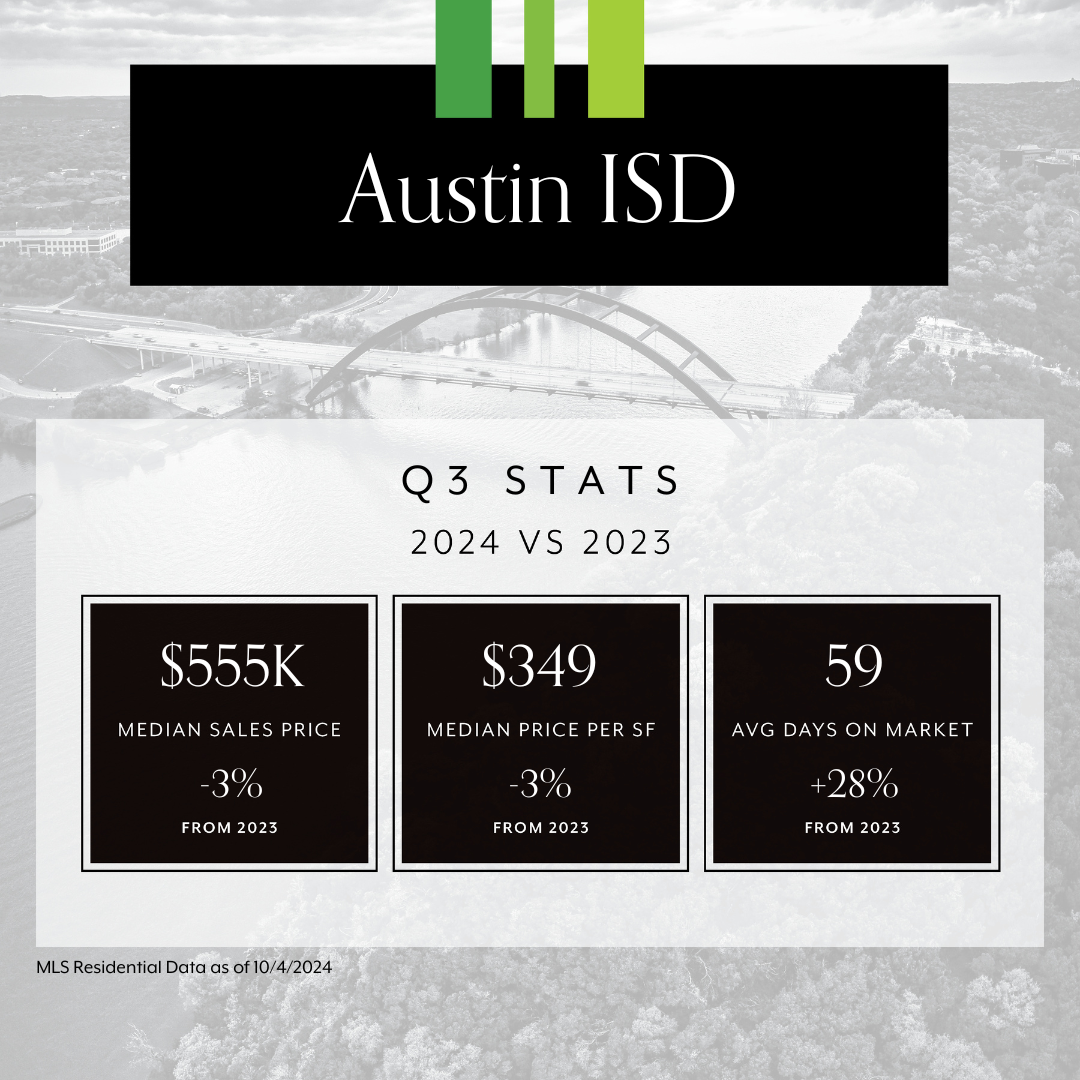
Austin ISD Q3 2024 stats: $555K median sales price, $349 per square foot, and 59 average days on market.

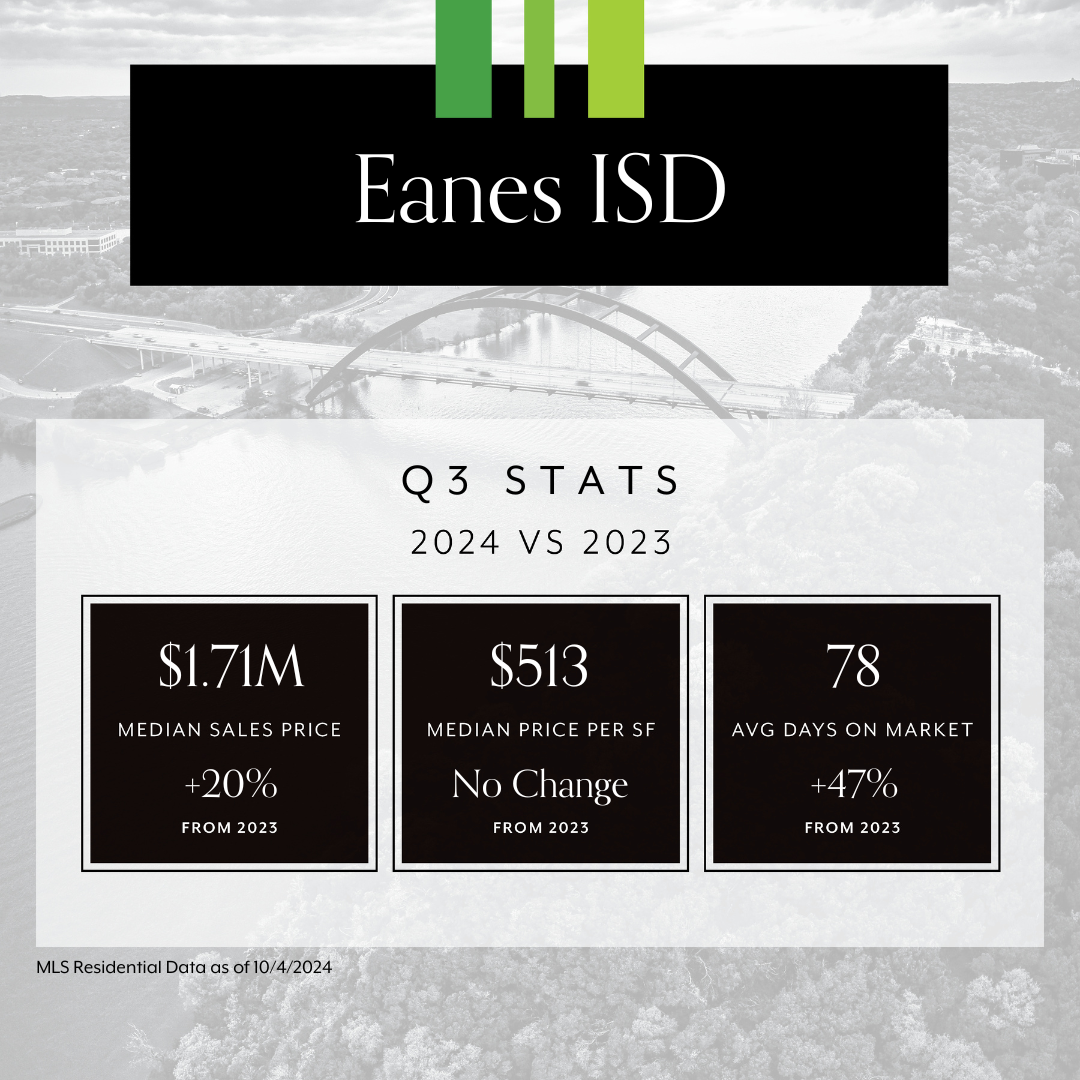
Eanes ISD Q3 2024 real estate statistics compared with 2023: prices, price per square foot, and days on market.

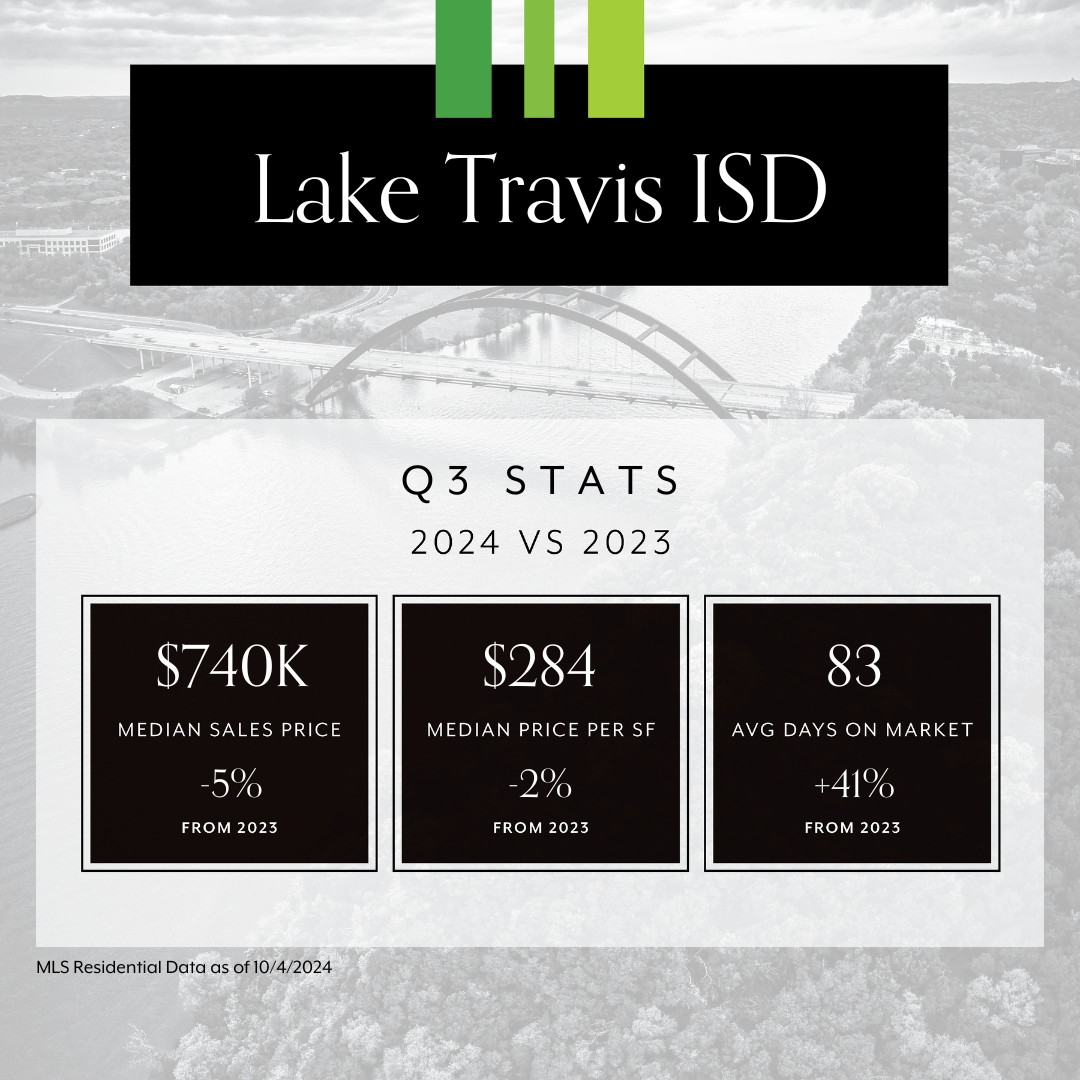
Lake Travis ISD Q3 real estate statistics: $740K median sale price, $284 per square foot, and 83 average market days.

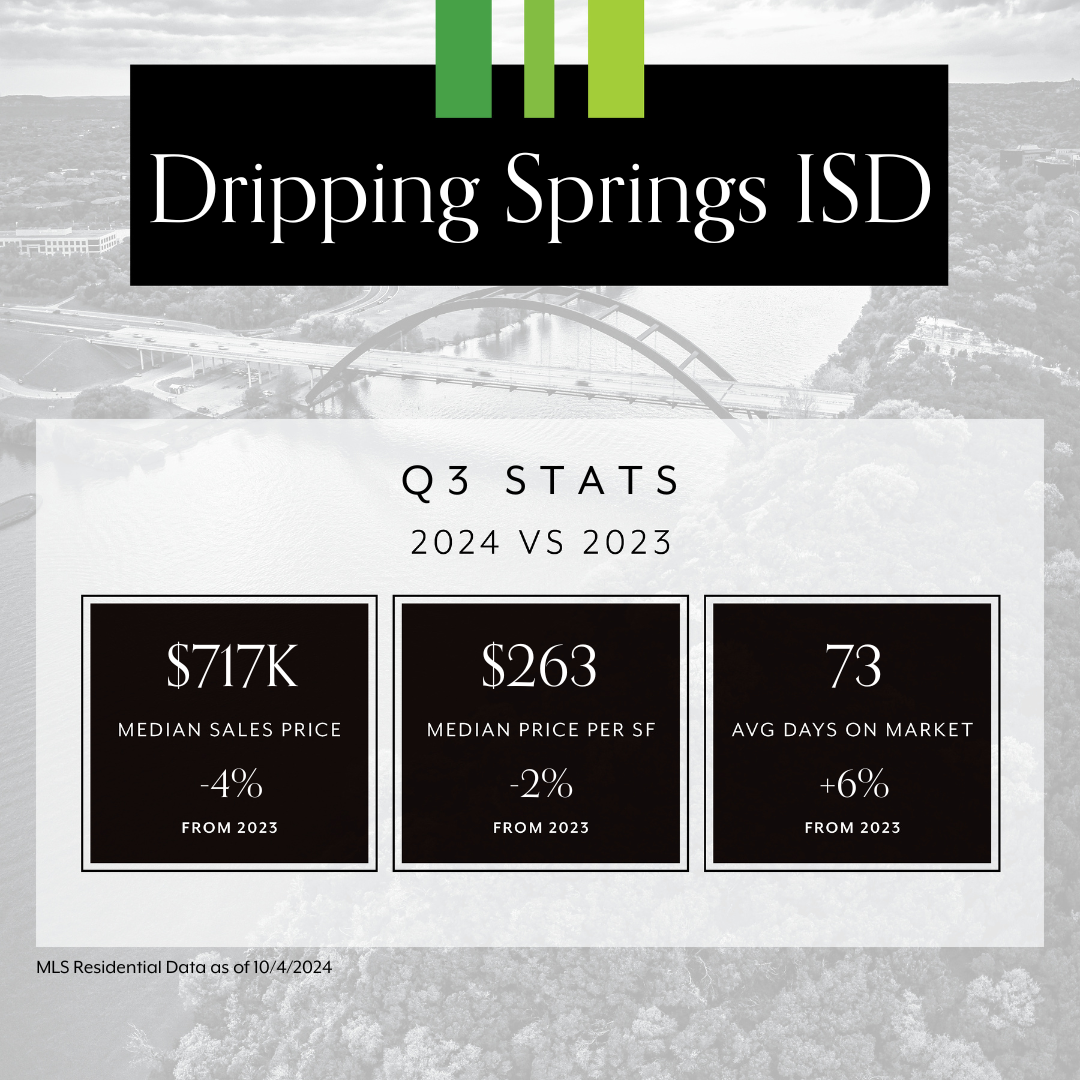
Dripping Springs ISD Q3 2024 statistics: $717K median sales price, $263 per square foot, and 73 average days on market.

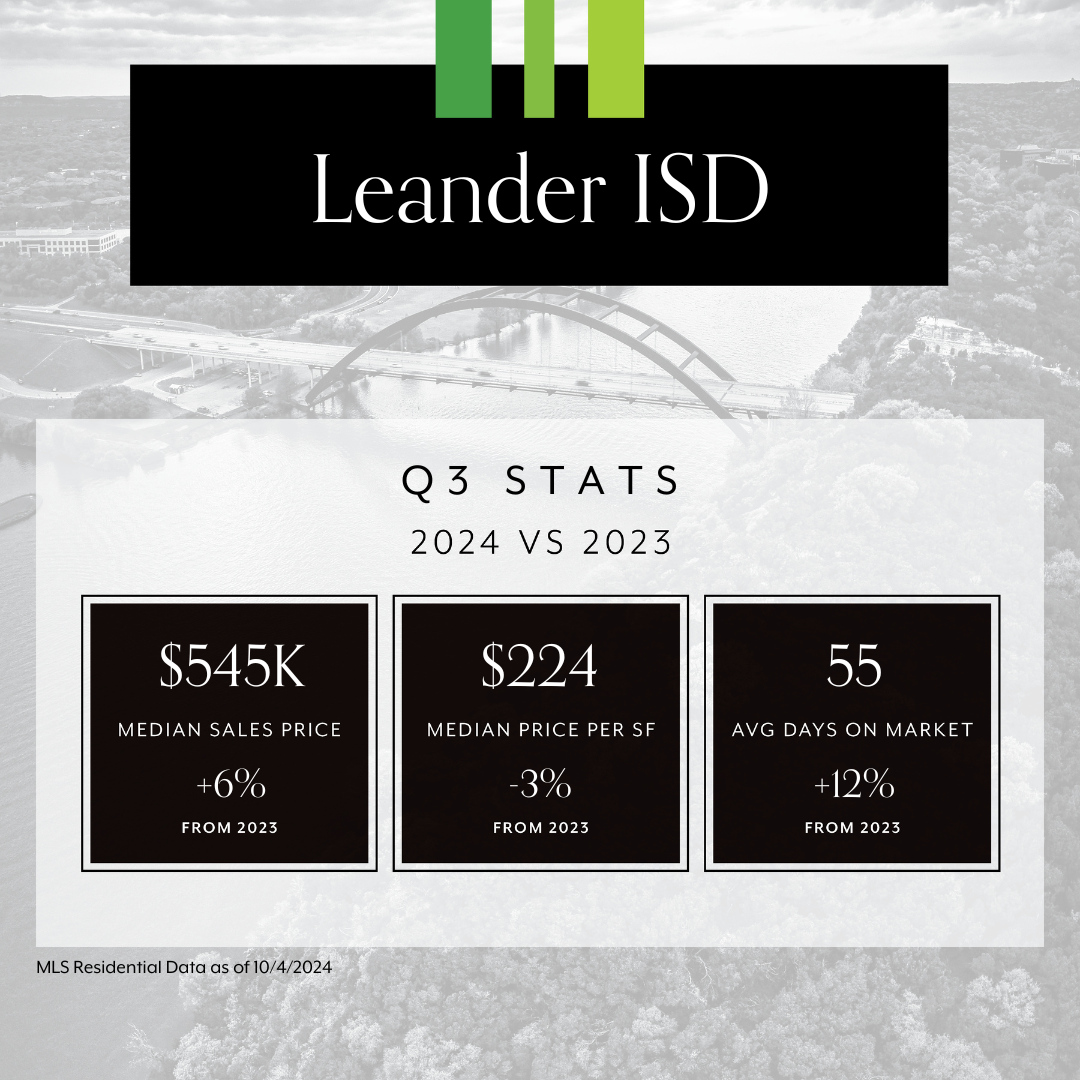
Leander ISD Q3 real estate statistics: prices and days on market compared with 2023.

Work With Greg

Greg connects people to their neighborhoods, to Austin, and to each other—but not necessarily in that order. People are the reason behind his work, and his love of this city makes it a lot of fun. Contact Greg today!

Follow Me on Instagram