Moreland’s Mid-Year Market Review

Moreland’s Mid-Year Market Review

With the second quarter having wrapped up at the beginning of this month, now is an apt time to look at Austin’s real estate market statistics.

Inventory levels in Austin and surrounding areas are higher than what we have seen in recent years. Currently standing at 5.19 months of inventory, this increase offers more opportunities for motivated buyers eager to explore their options. Six months of inventory is widely considered a “balanced market,” with anything below indicating a “seller’s market.” Many buyers find themselves holding out for lower interest rates but they need to be mindful that lower rates tend to drive up demand which in turn will drive up prices.

Recent numbers from the US Census Bureau indicate that for the first time in over 20 years more people are moving out of Travis County versus migrating in. However, dreams of lesser traffic on your commute may be quickly fading with Elon Musk’s alleged plans to relocate X & Space X’s Headquarters to Texas. 

If you are contemplating the ideal time to buy or sell, rely on our expertise to guide you through the intricacies of the market. While we don’t claim to have a crystal ball, we are dedicated to helping you navigate and succeed during all types of market conditions. Allow us to develop a personalized strategy that encourages your peace of mind.

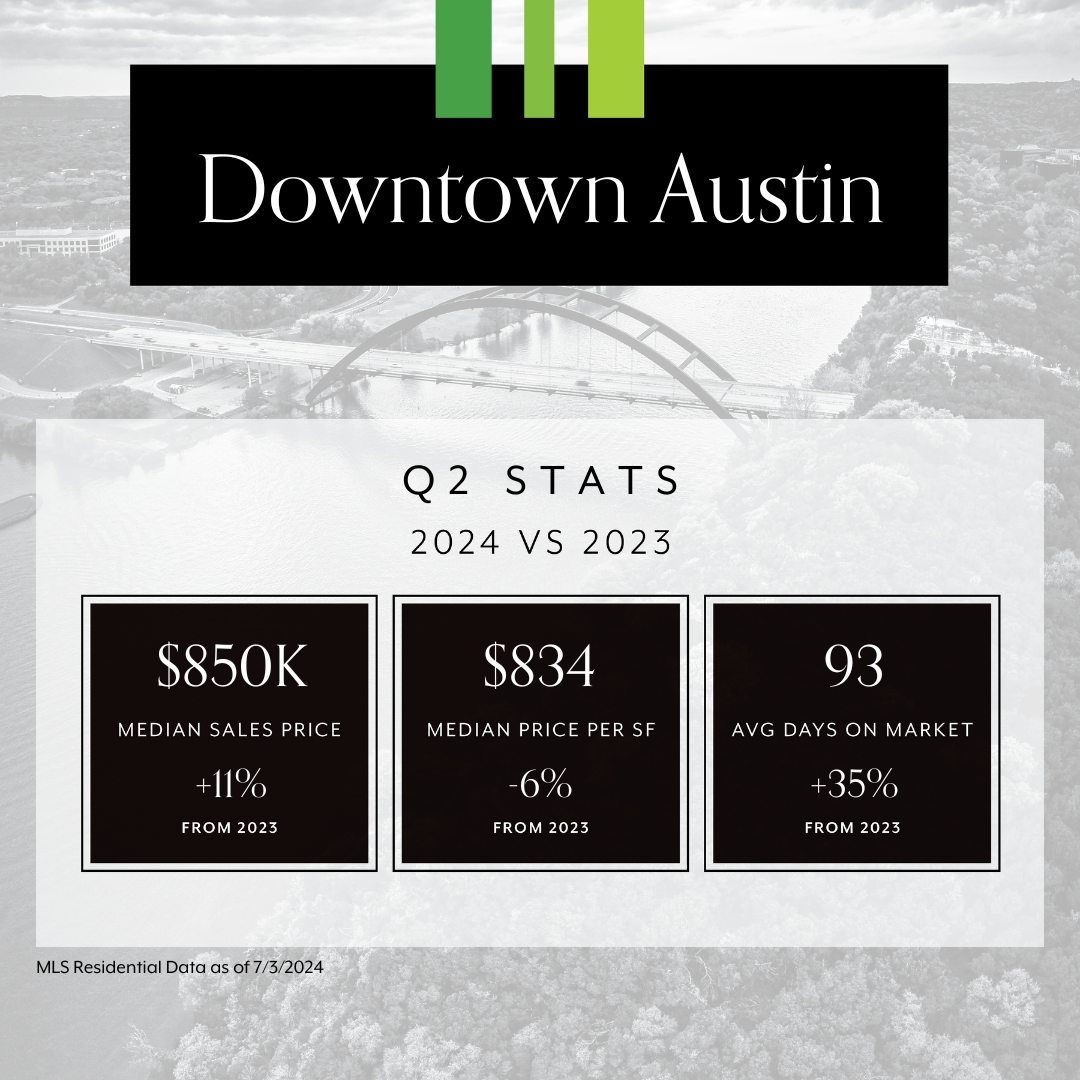
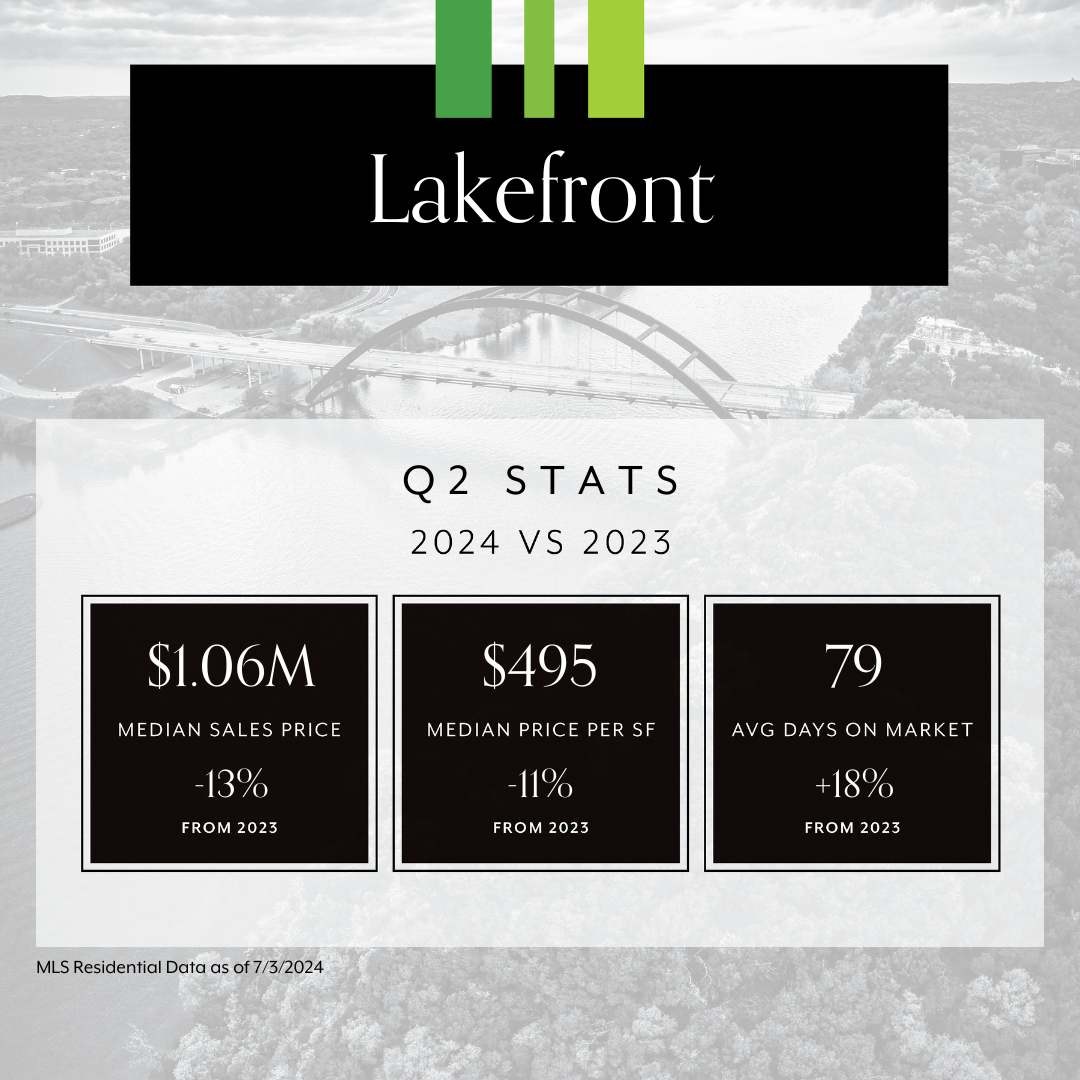
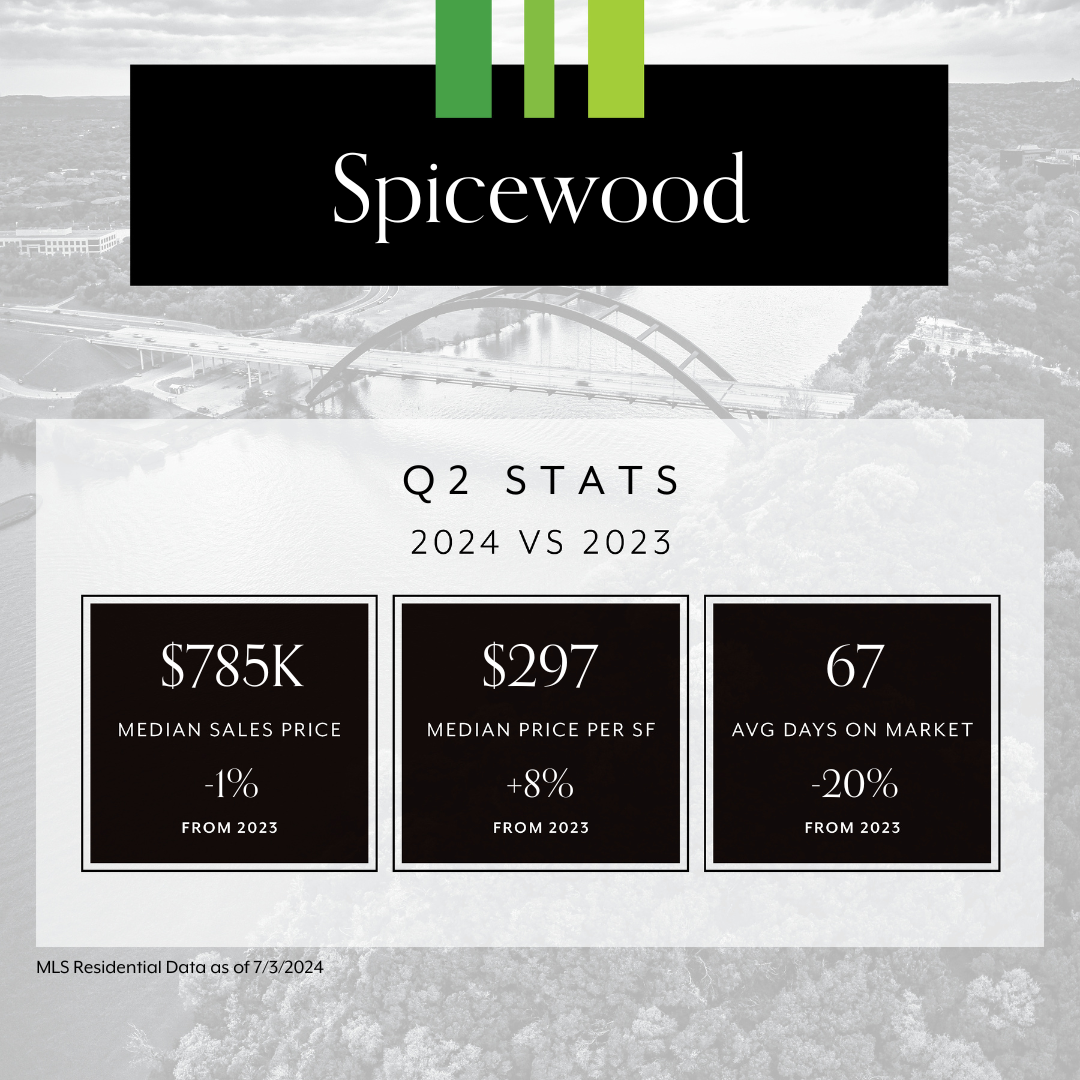
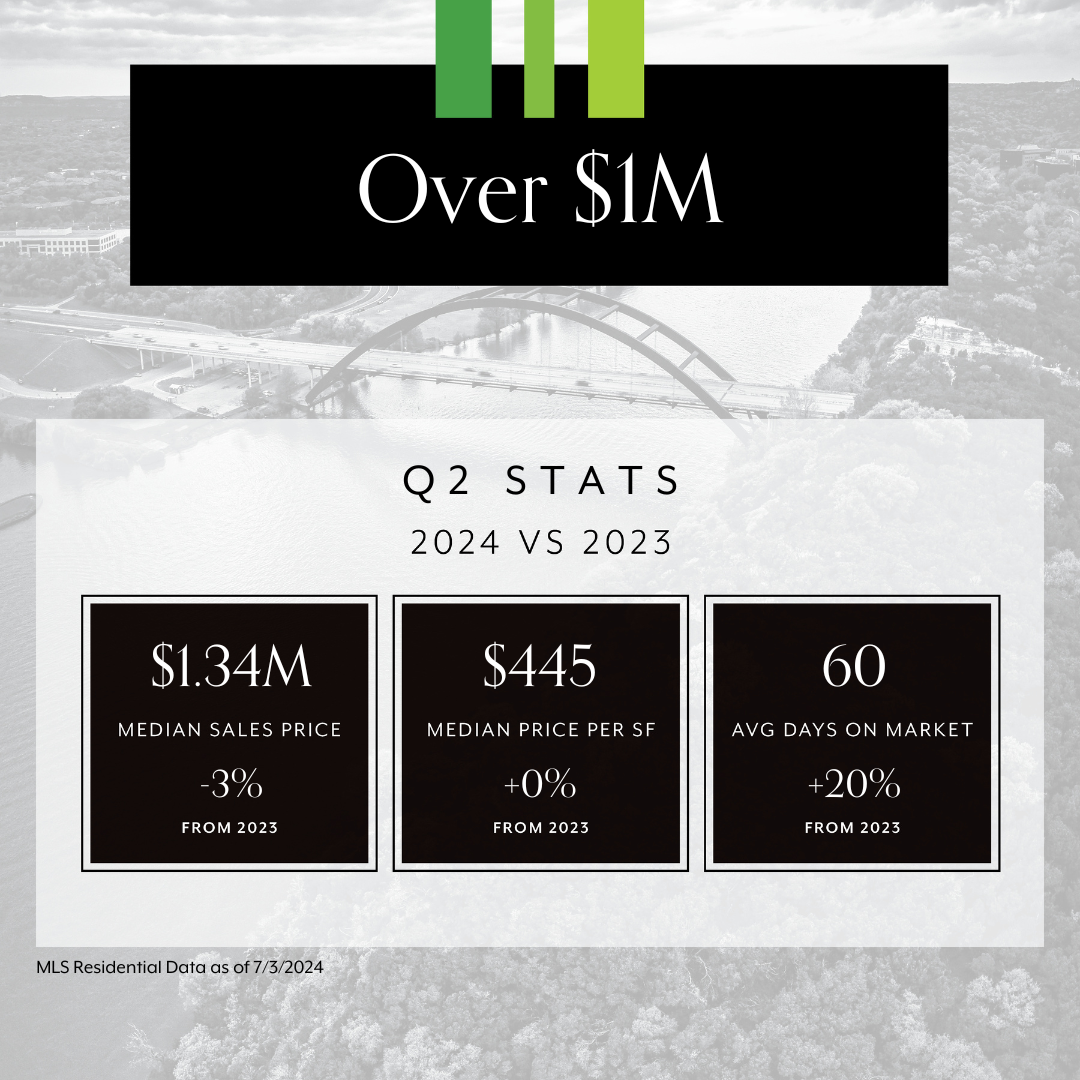
Take a look at the market stats below for a snapshot of the current market:
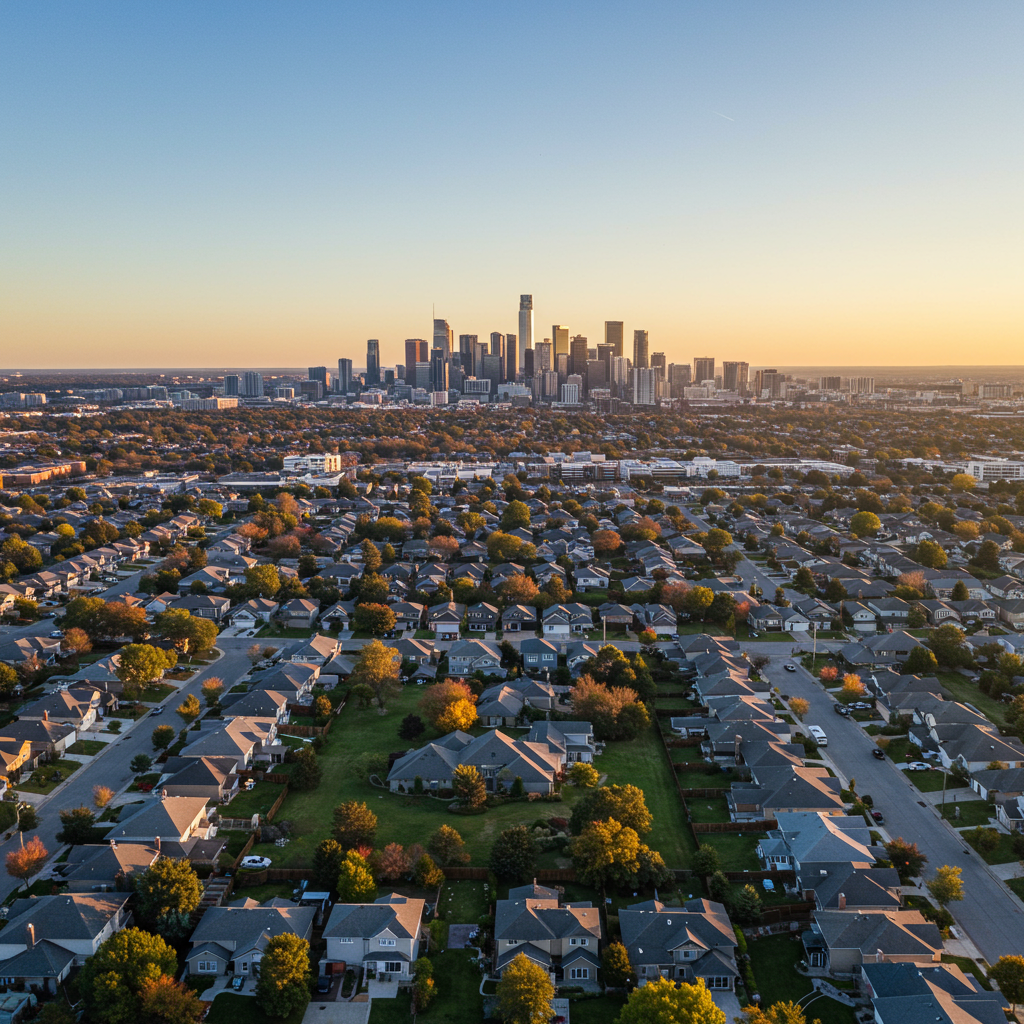
Aerial view of suburban homes and tree-lined streets with a distant city skyline.

Downtown Austin Q2 2024 market statistics compared with 2023.

Lakefront Q2 2024 market stats: $1.06M median price, $495 per square foot, and 79 average days on market.

Spicewood Q2 2024 real estate stats: median price $785K, price per square foot $297, and 67 average days on market.

Q2 2024 market stats: $1.34M median sale price, $445 per square foot, and 60 average days on market.

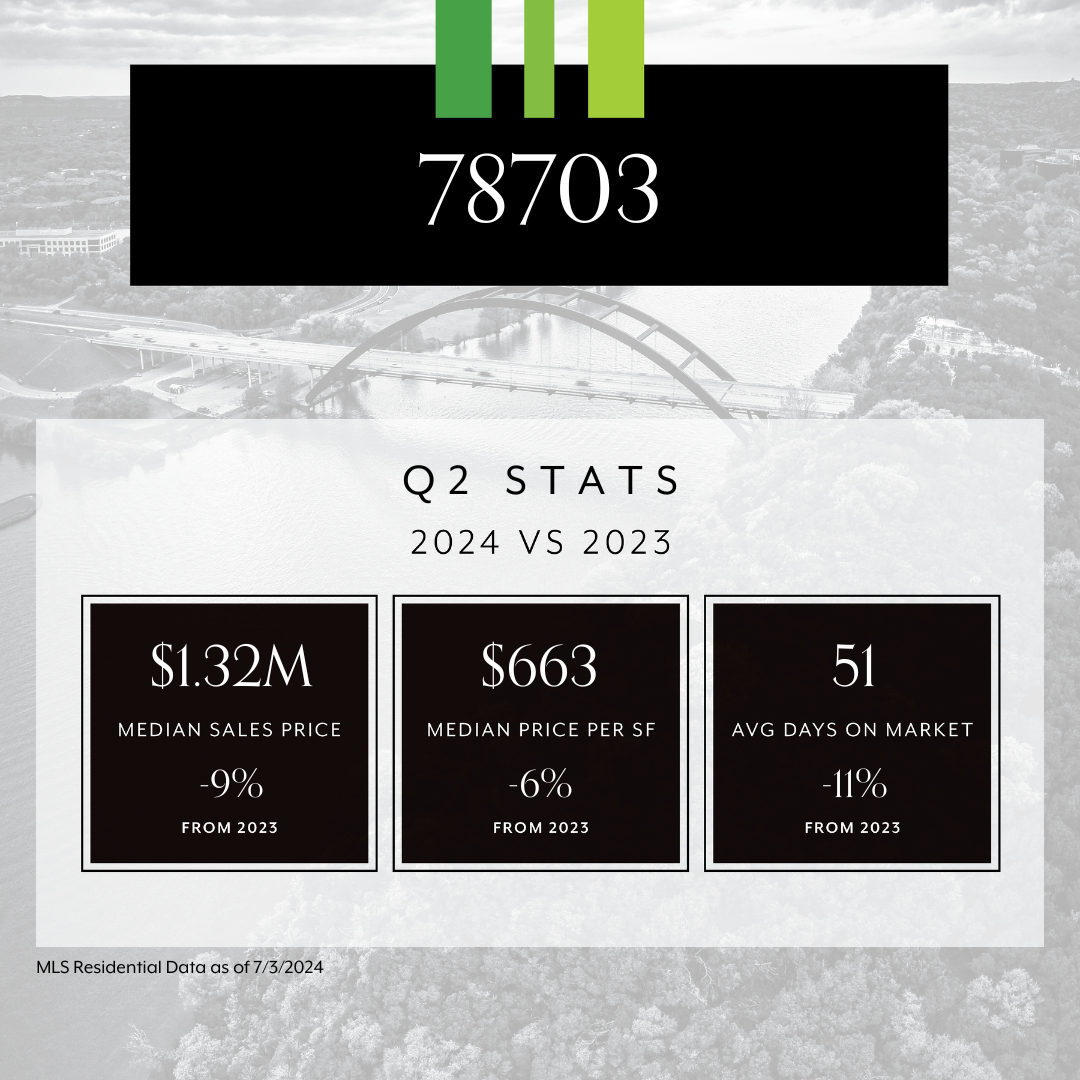
78703 Q2 2024 market stats: $1.32M median sale price, $663 per square foot, and 51 average days on market.

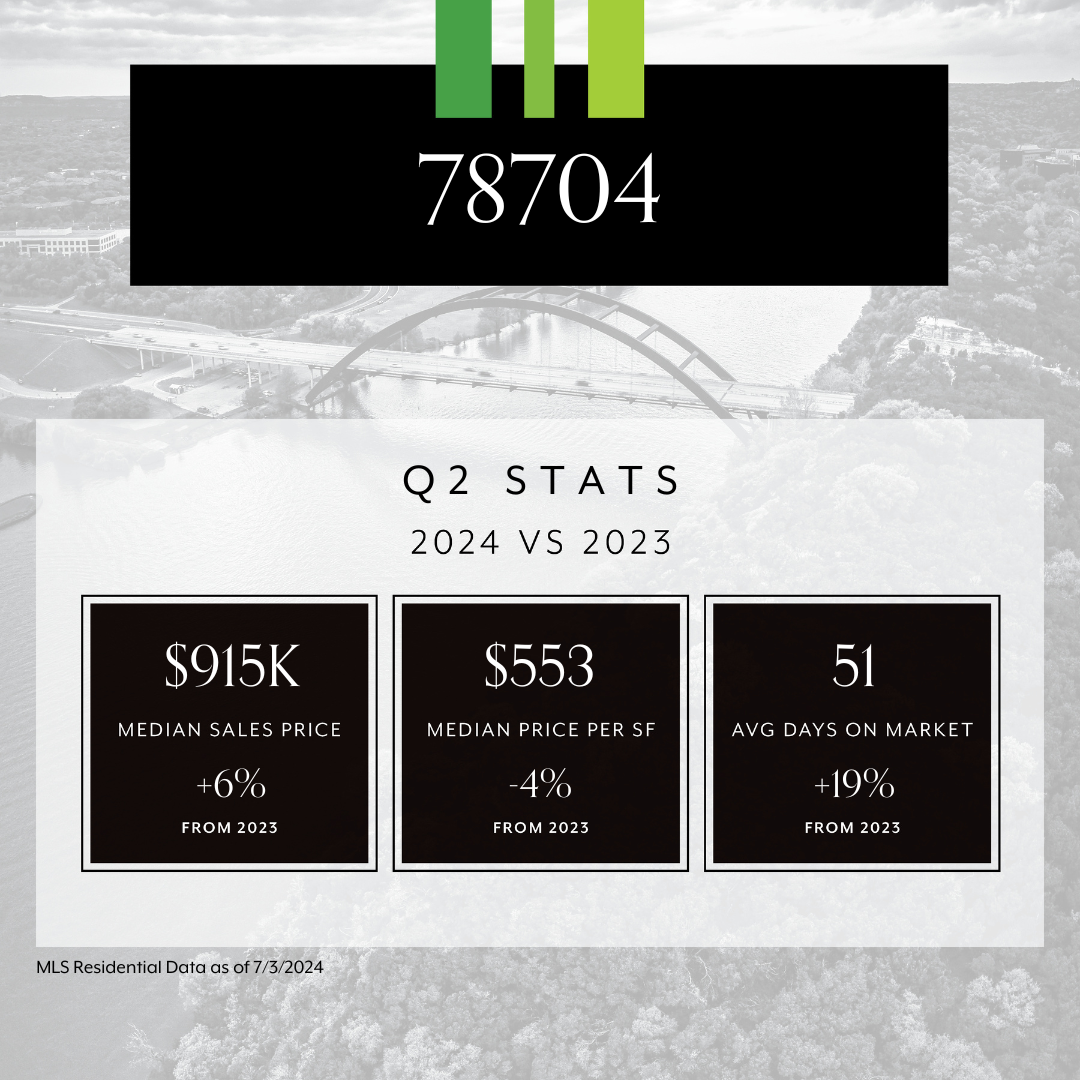
78704 Q2 market stats: $915K median sales price, $553 per square foot, and 51 average days on market.

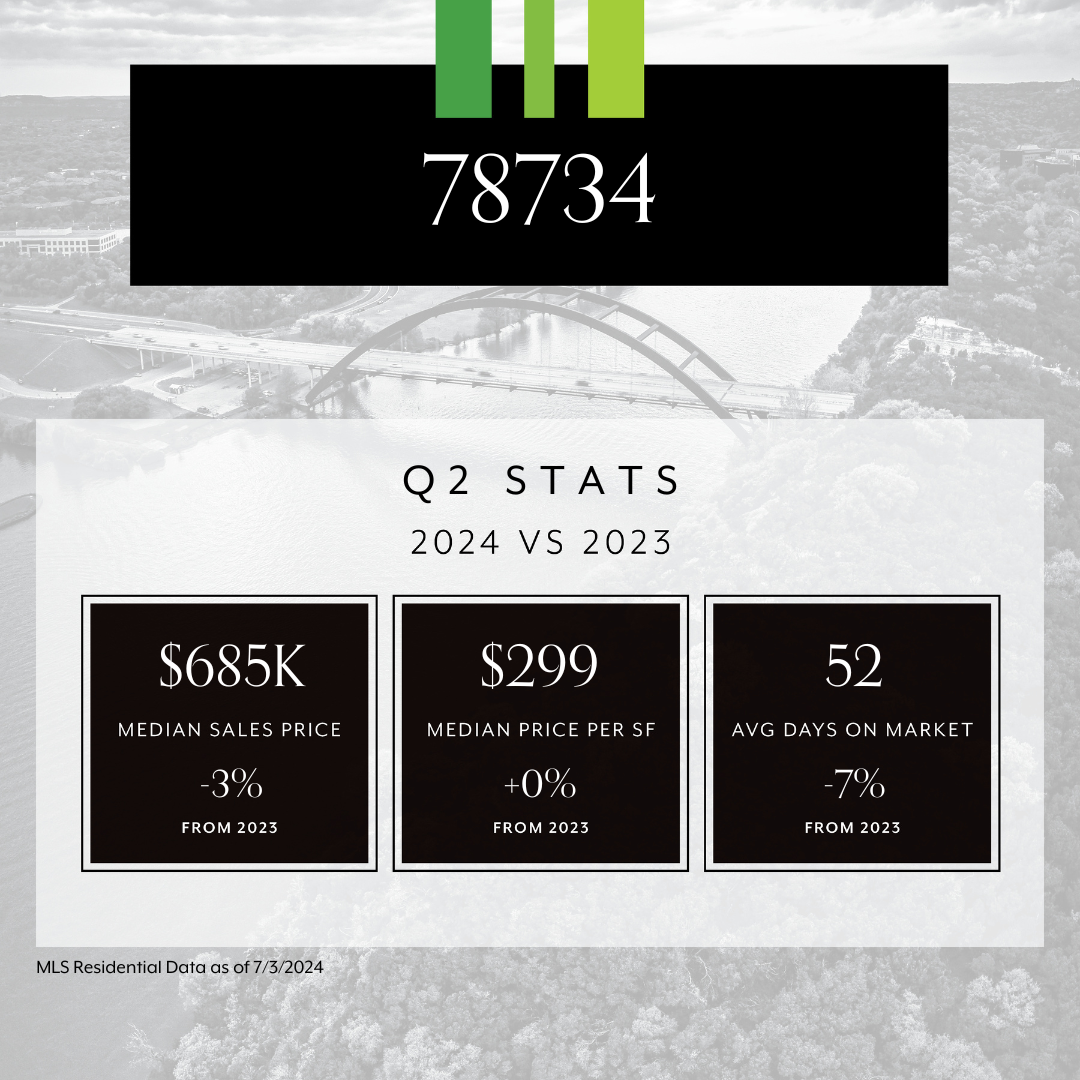
78734 Q2 market statistics: $685K median price, $299 per square foot, and 52 average days on market.

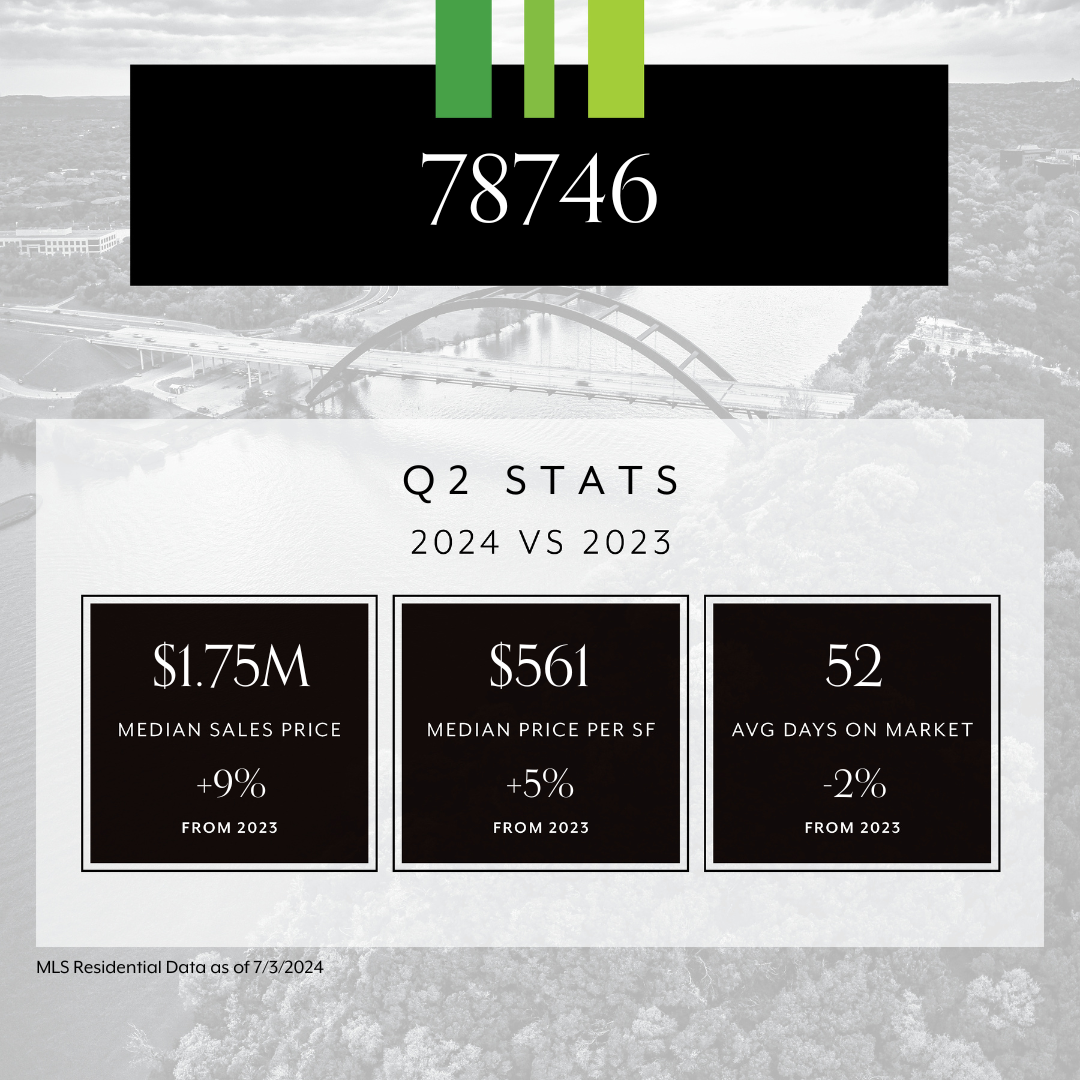
Q2 2024 market stats for 78746: $1.75 million median price, $561 per square foot, 52 average days on market.

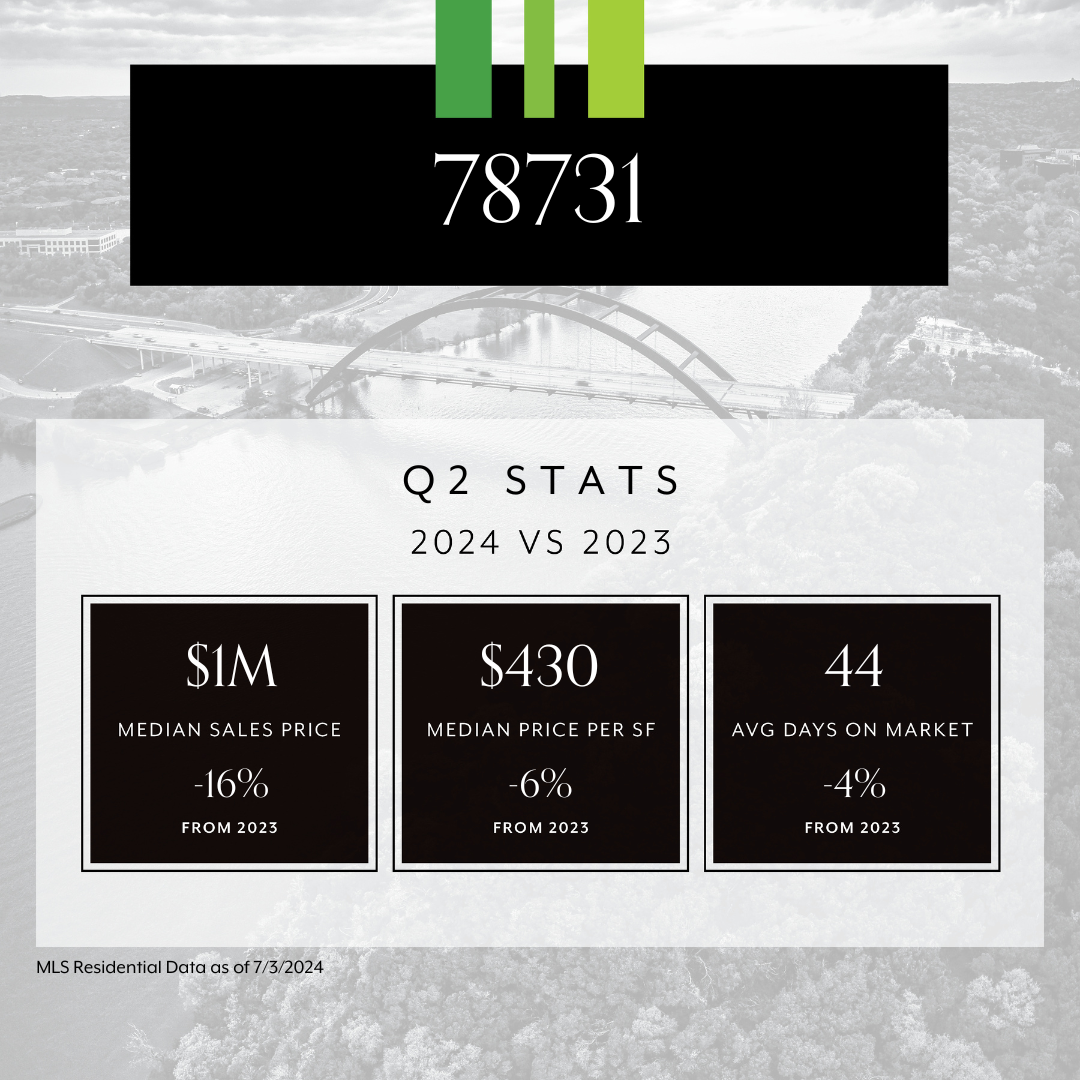
78731 Q2 real estate statistics comparing 2024 with 2023: median price, price per square foot, and days on market.

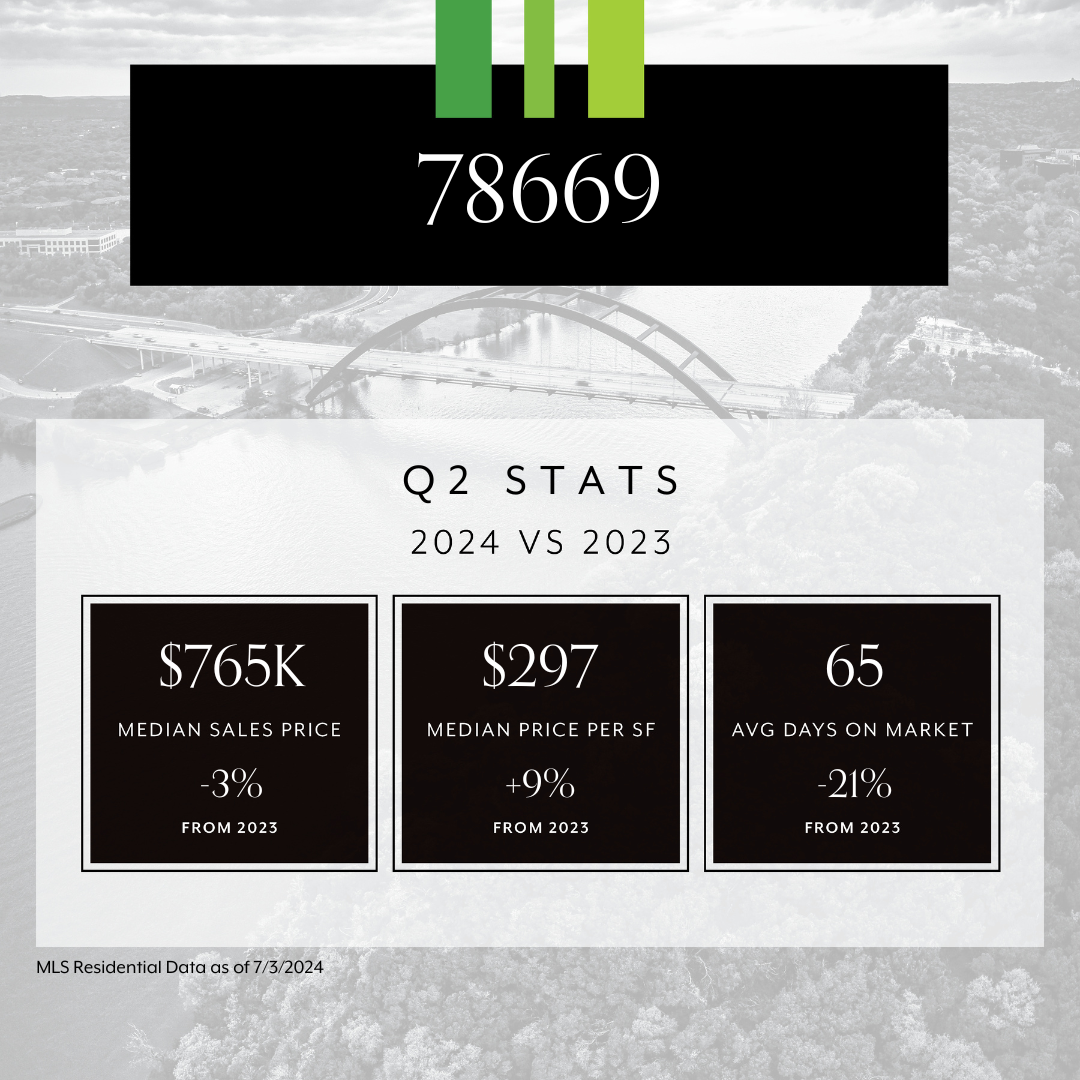
Q2 2024 market statistics: $765K median sales price, $297 per square foot, and 65 average days on market.

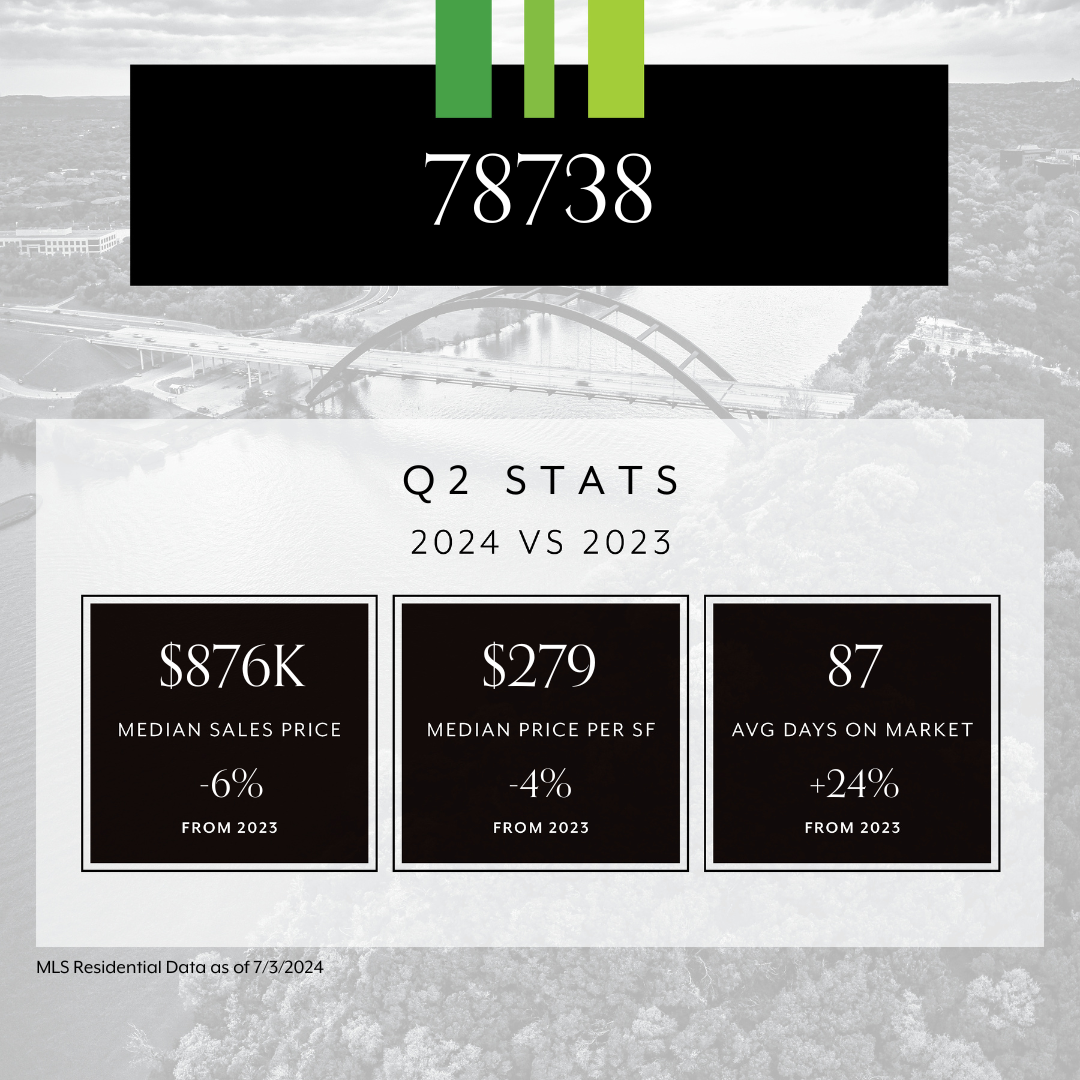
78738 Q2 market stats: $876K median price, $279 per square foot, and 87 average days on market.

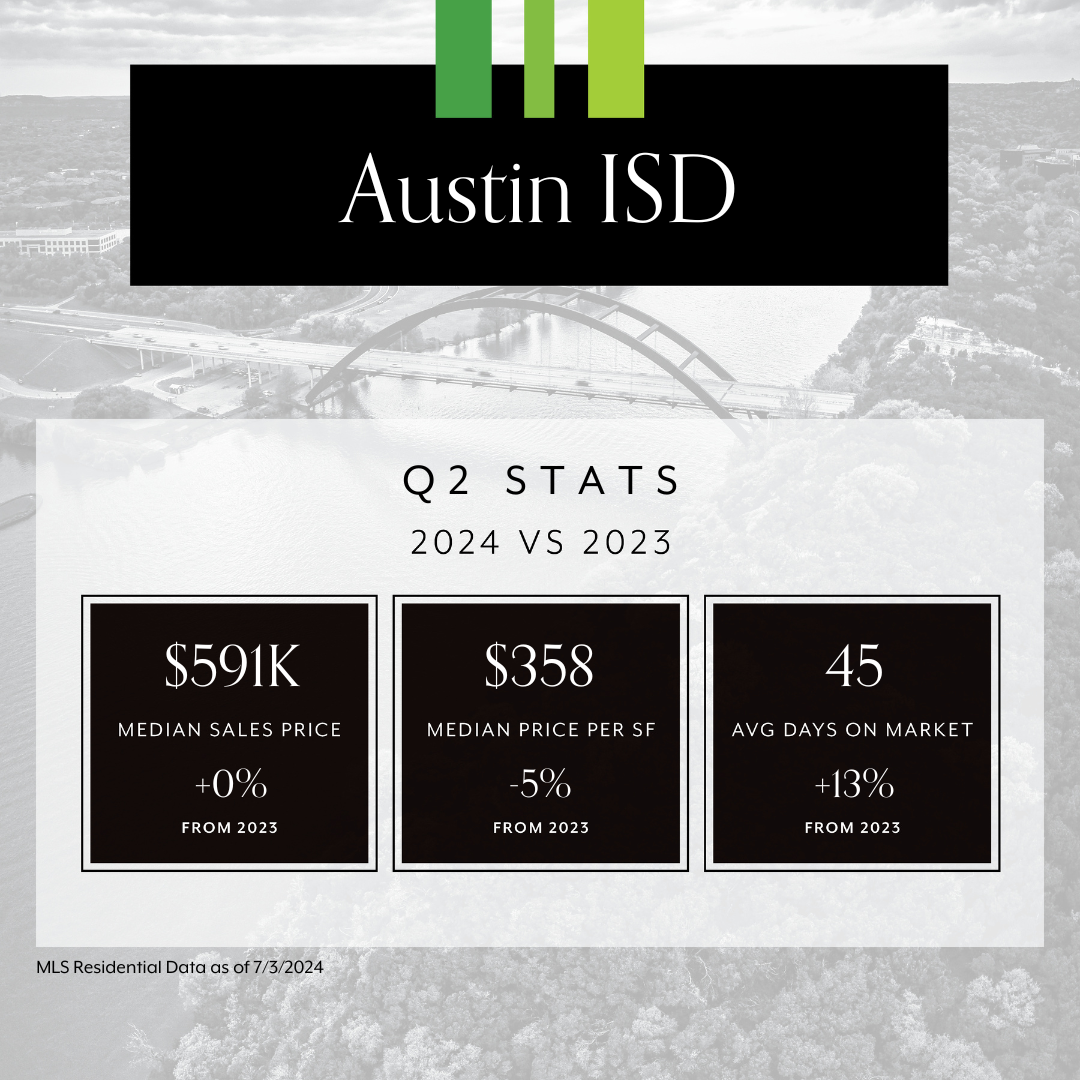
Q2 stats: $591K median sales price, $358 per square foot, and 45 average days on market.

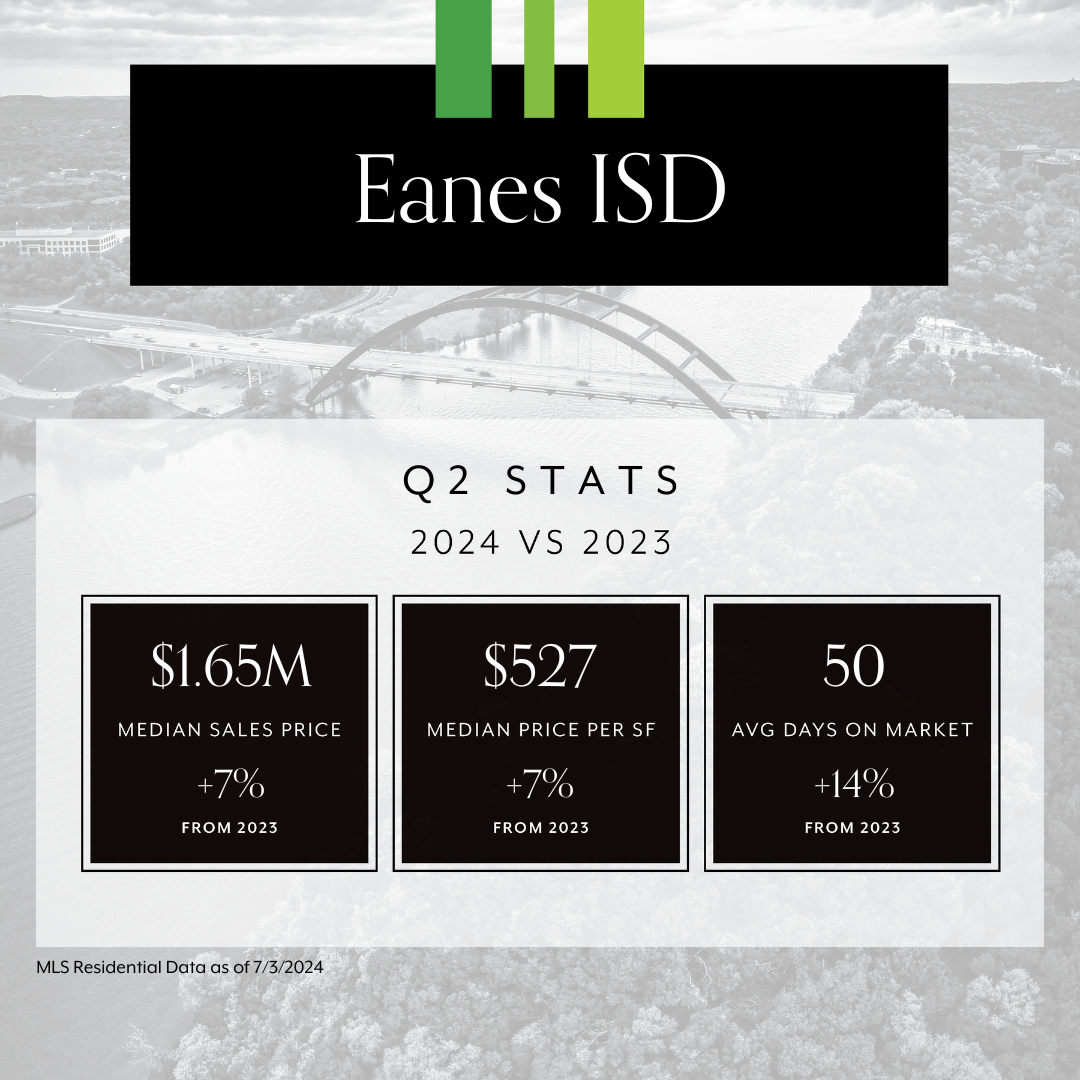
Eanes ISD Q2 2024 market statistics compared with 2023: prices rose 7%, and average market time rose 14%.

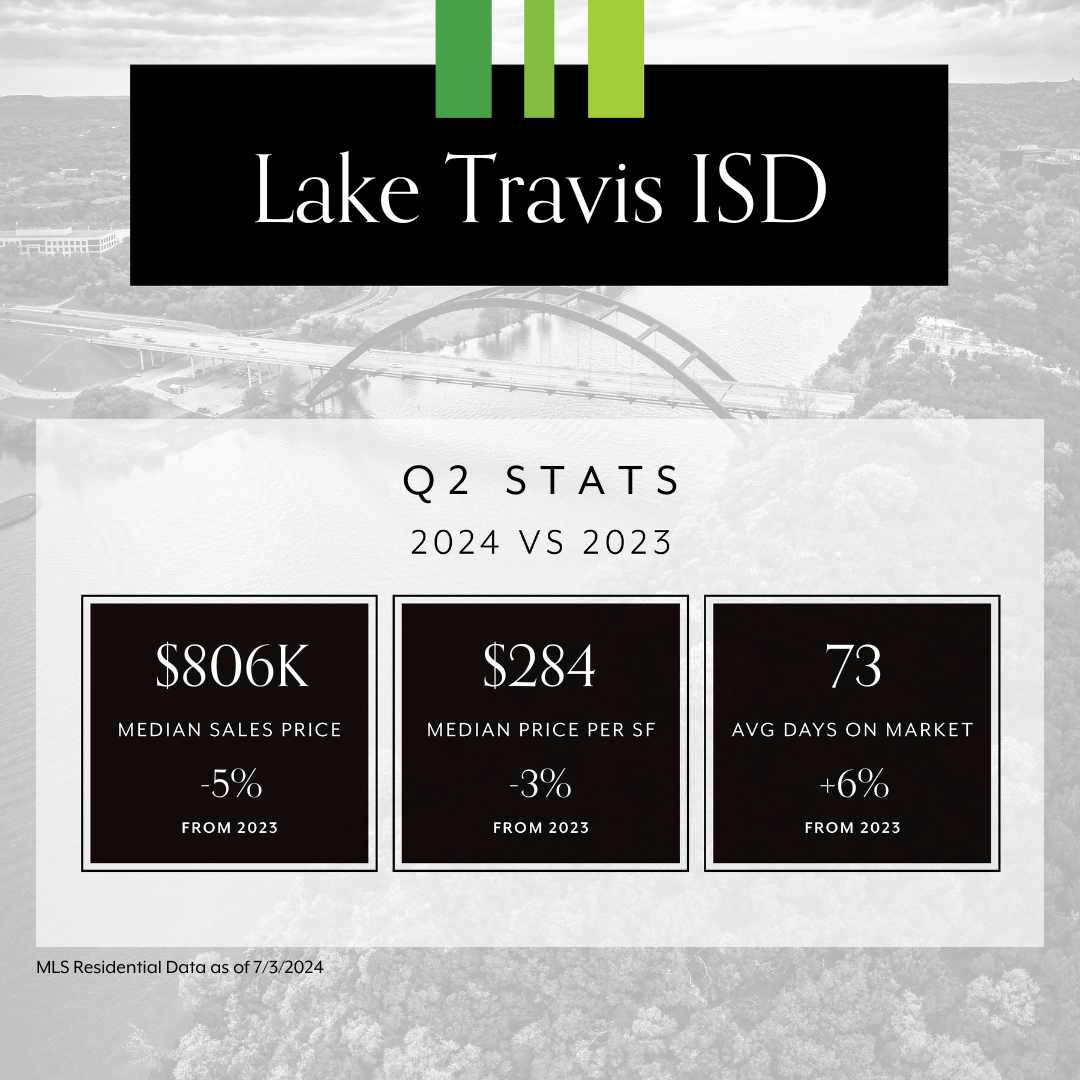
Lake Travis ISD Q2 stats: median price $806K, down 5%; price per square foot $284, down 3%; 73 days on market, up 6%.

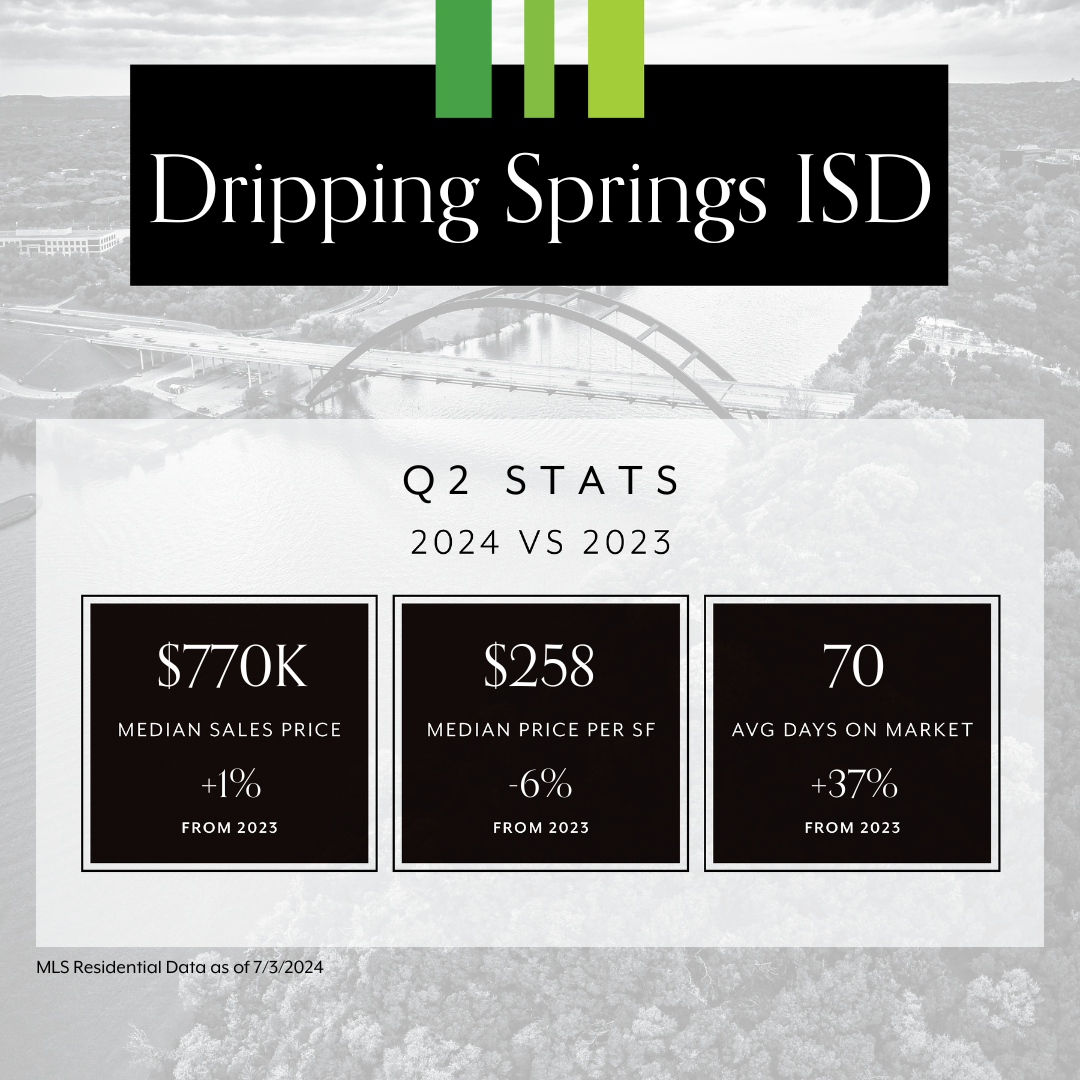
Dripping Springs ISD Q2 market statistics comparing median price, price per square foot, and days on market.

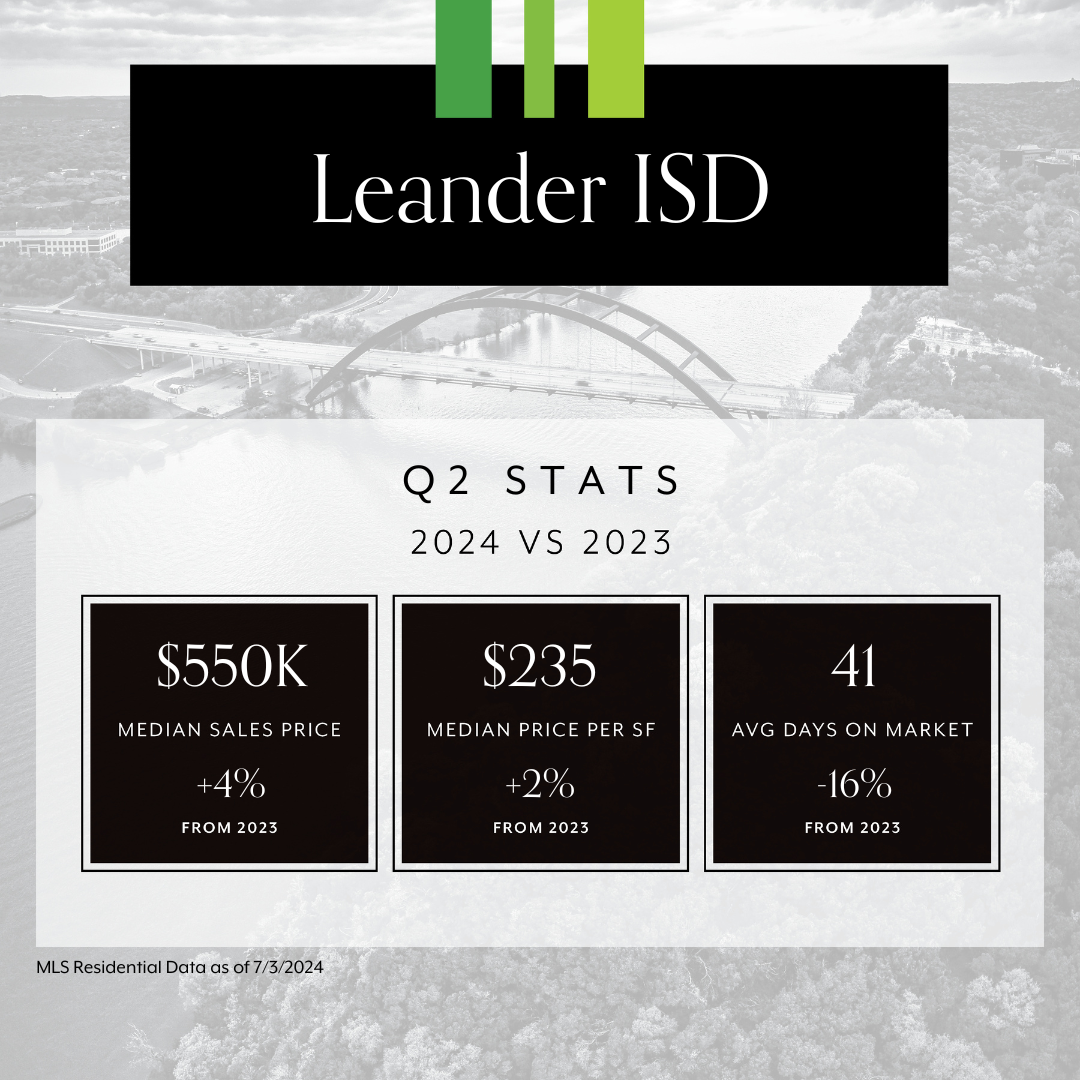
Leander ISD Q2 market statistics compared with 2023: median sales price, price per square foot, and days on market.

At Moreland Properties, we aim to keep our clients educated and informed on the ever-changing real estate industry. 

Work With Greg

Greg connects people to their neighborhoods, to Austin, and to each other—but not necessarily in that order. People are the reason behind his work, and his love of this city makes it a lot of fun. Contact Greg today!

Follow Me on Instagram