2025 Q1 Stats

2025 Q1 Stats

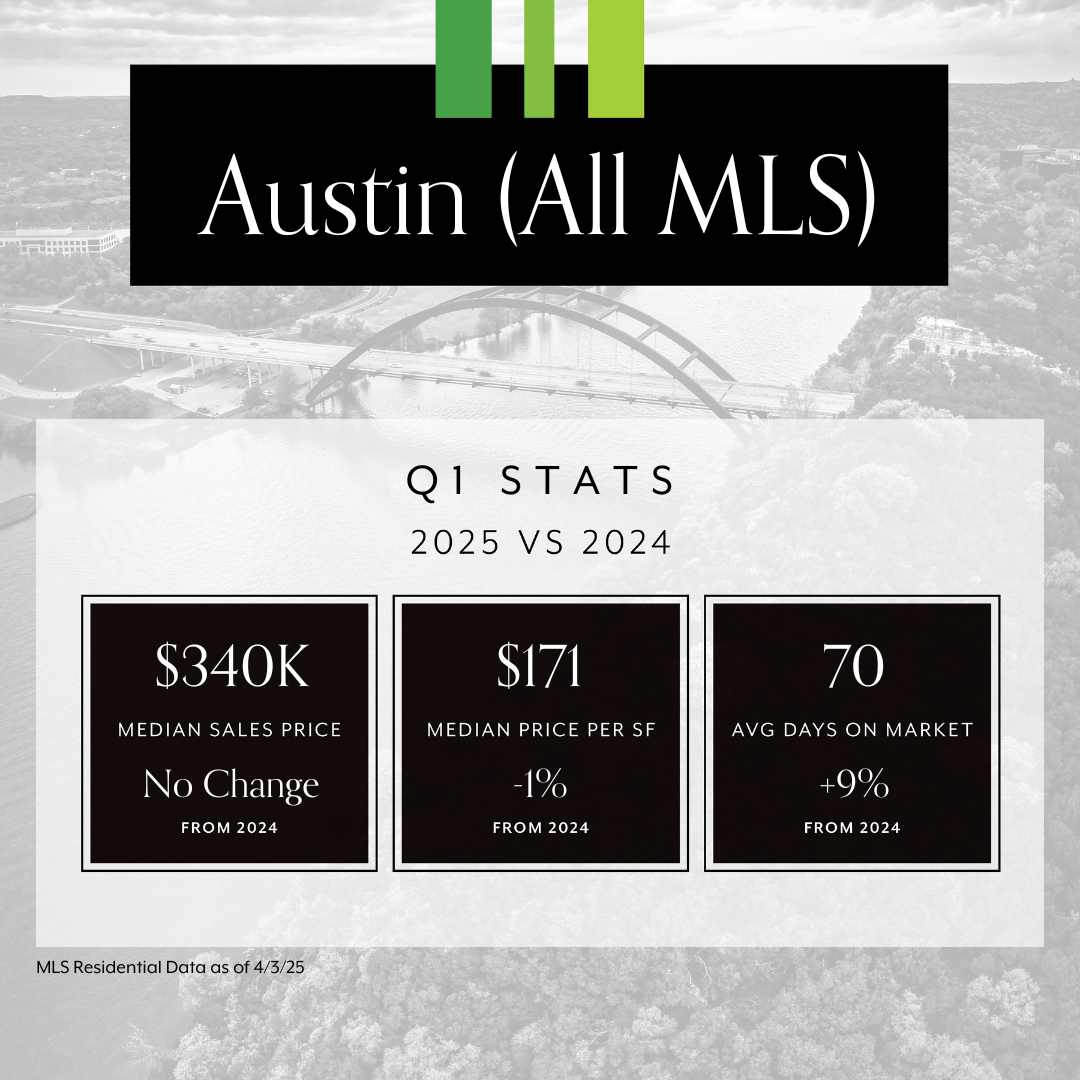
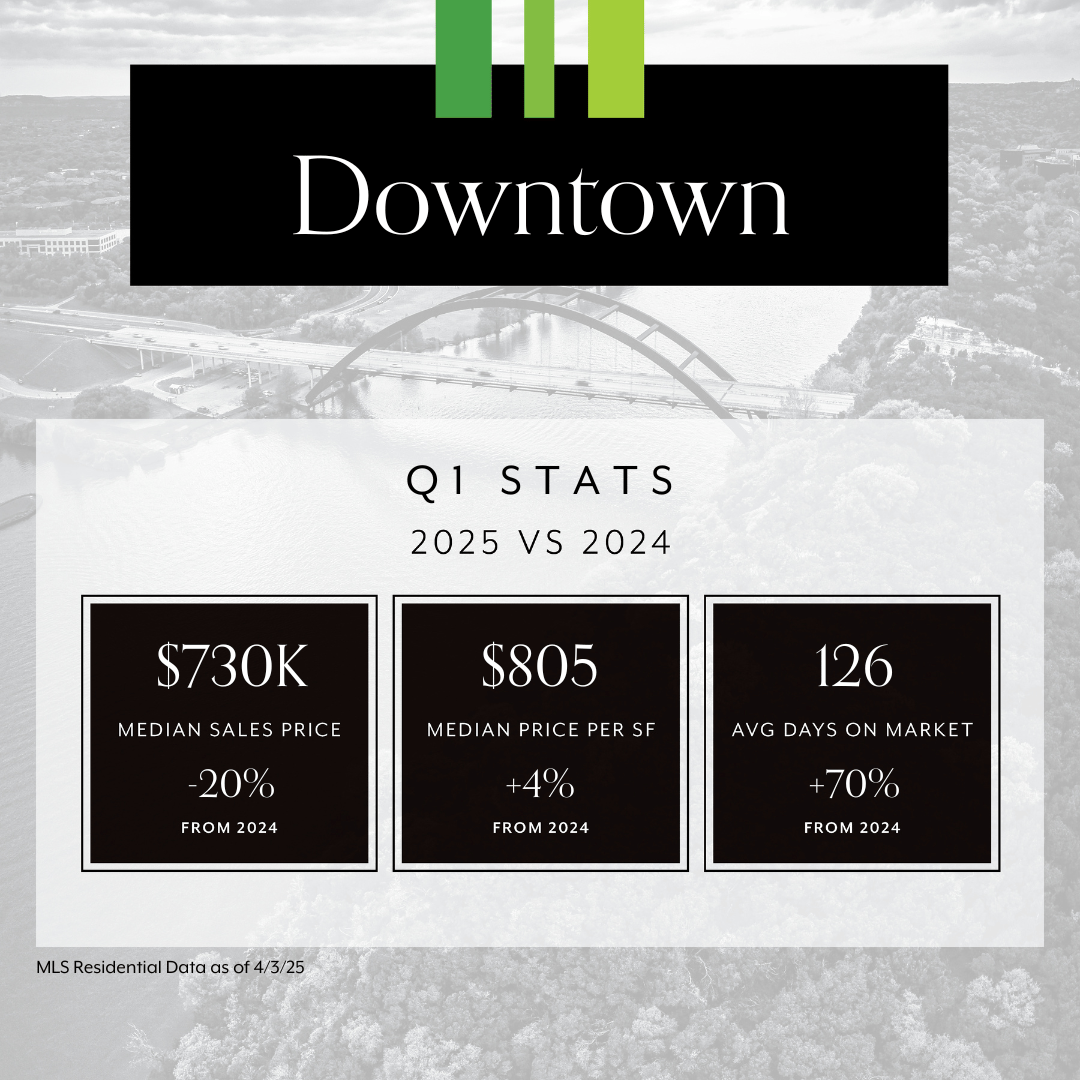
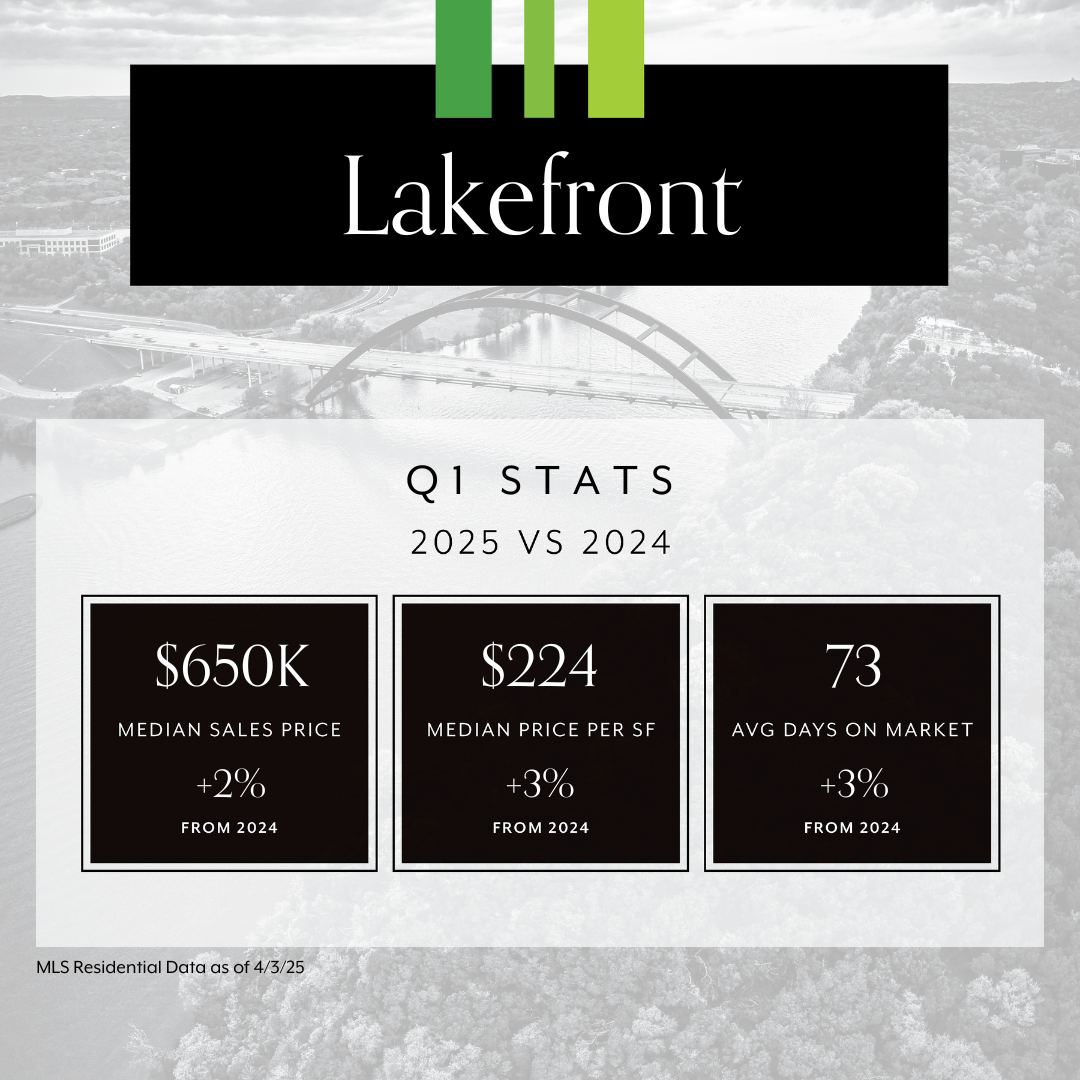
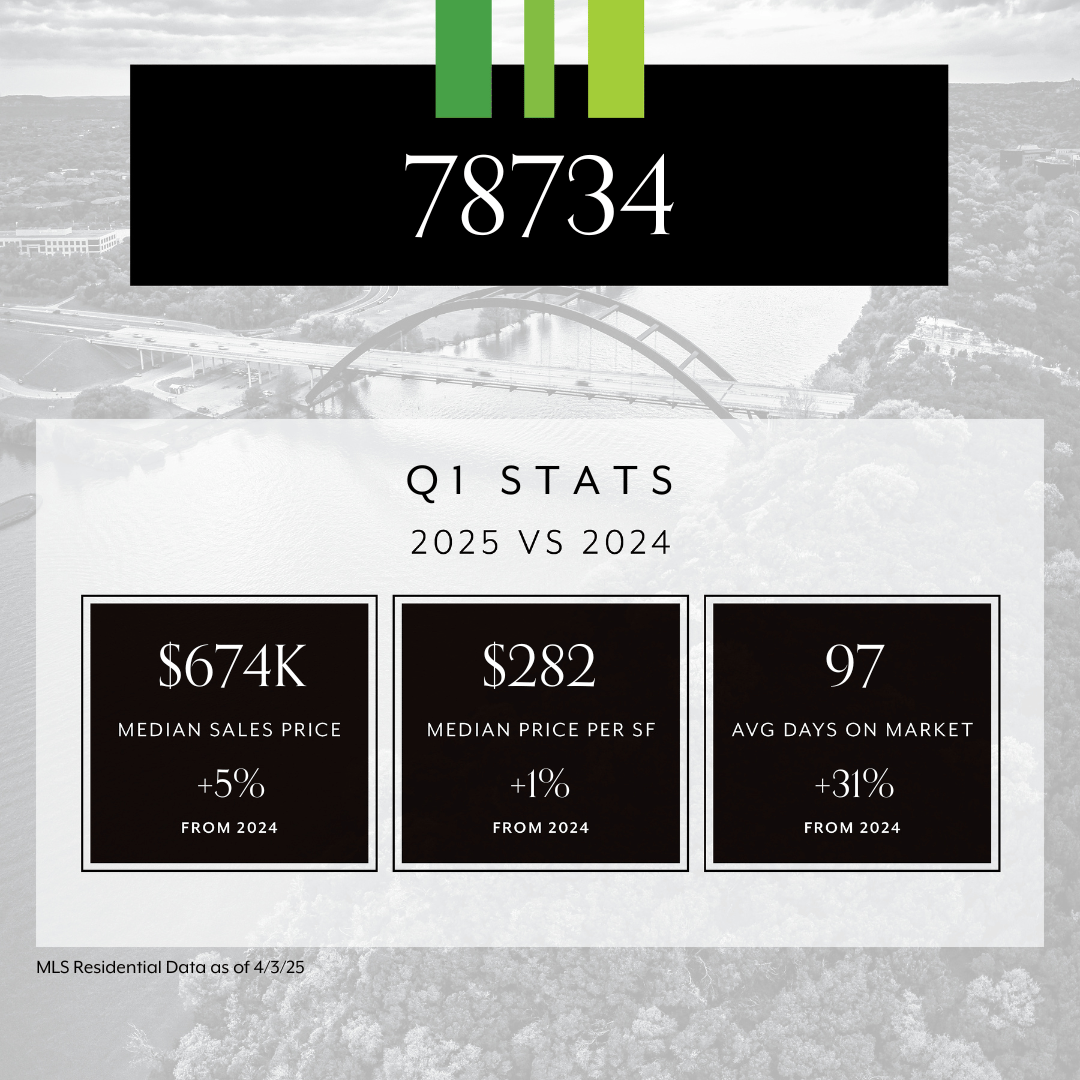
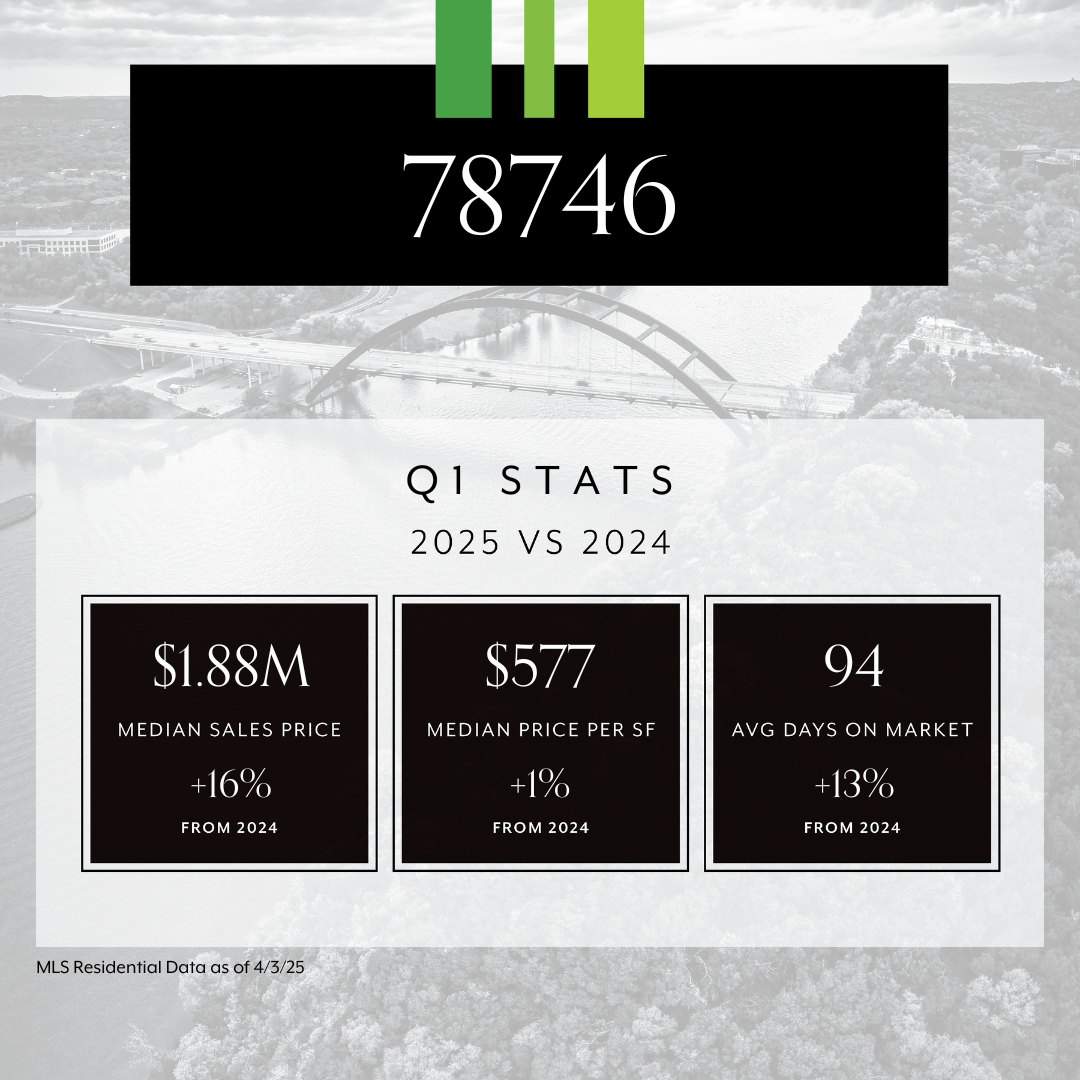
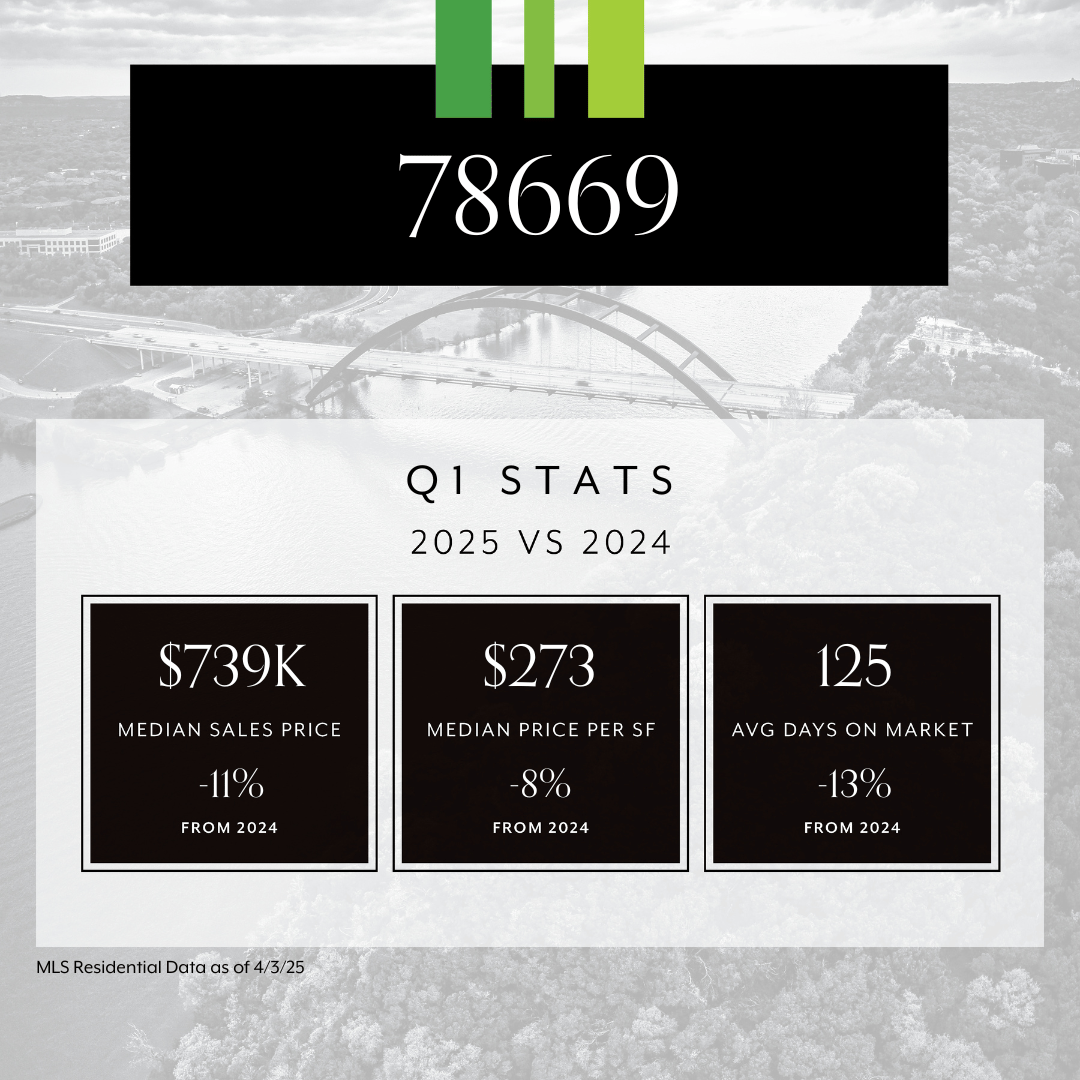
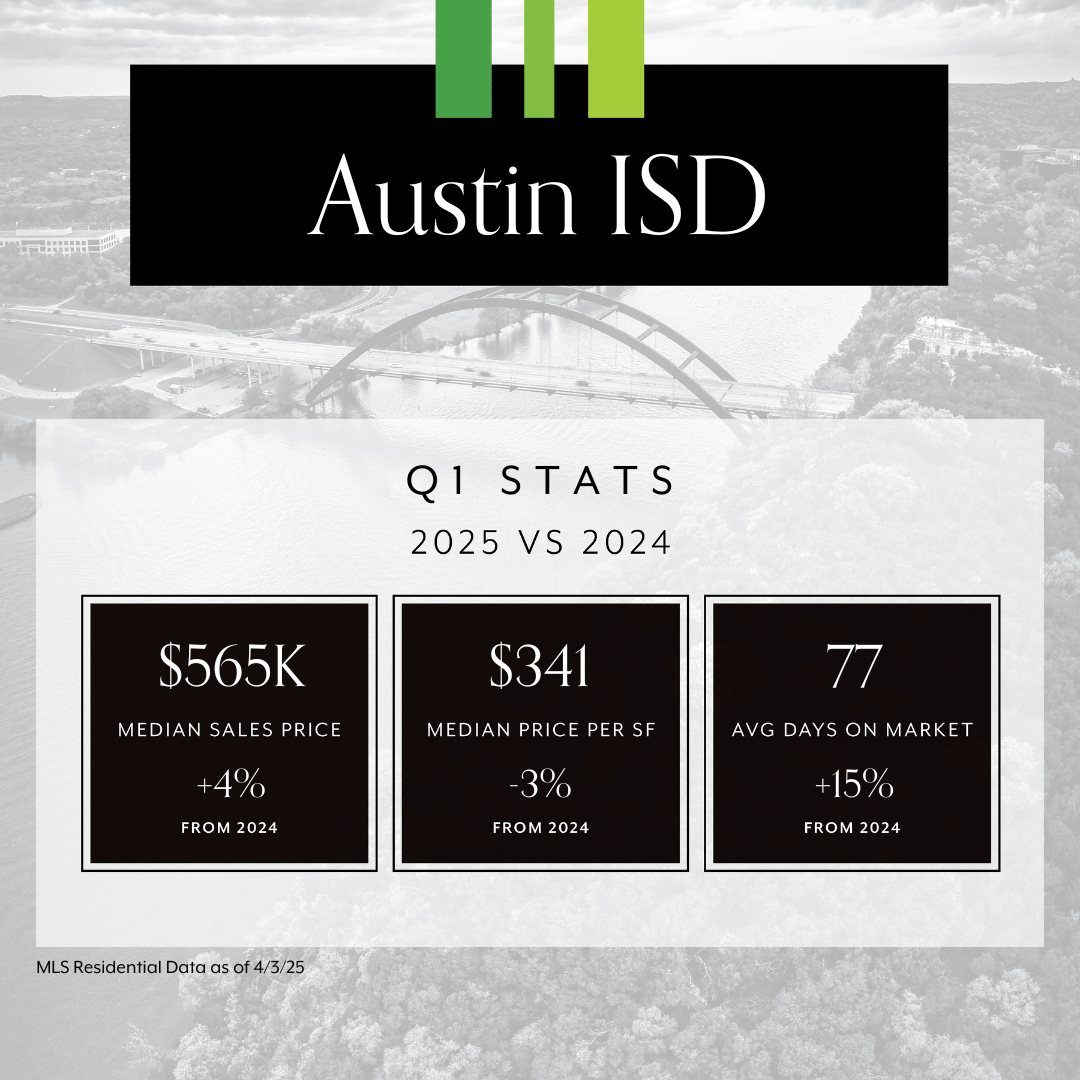
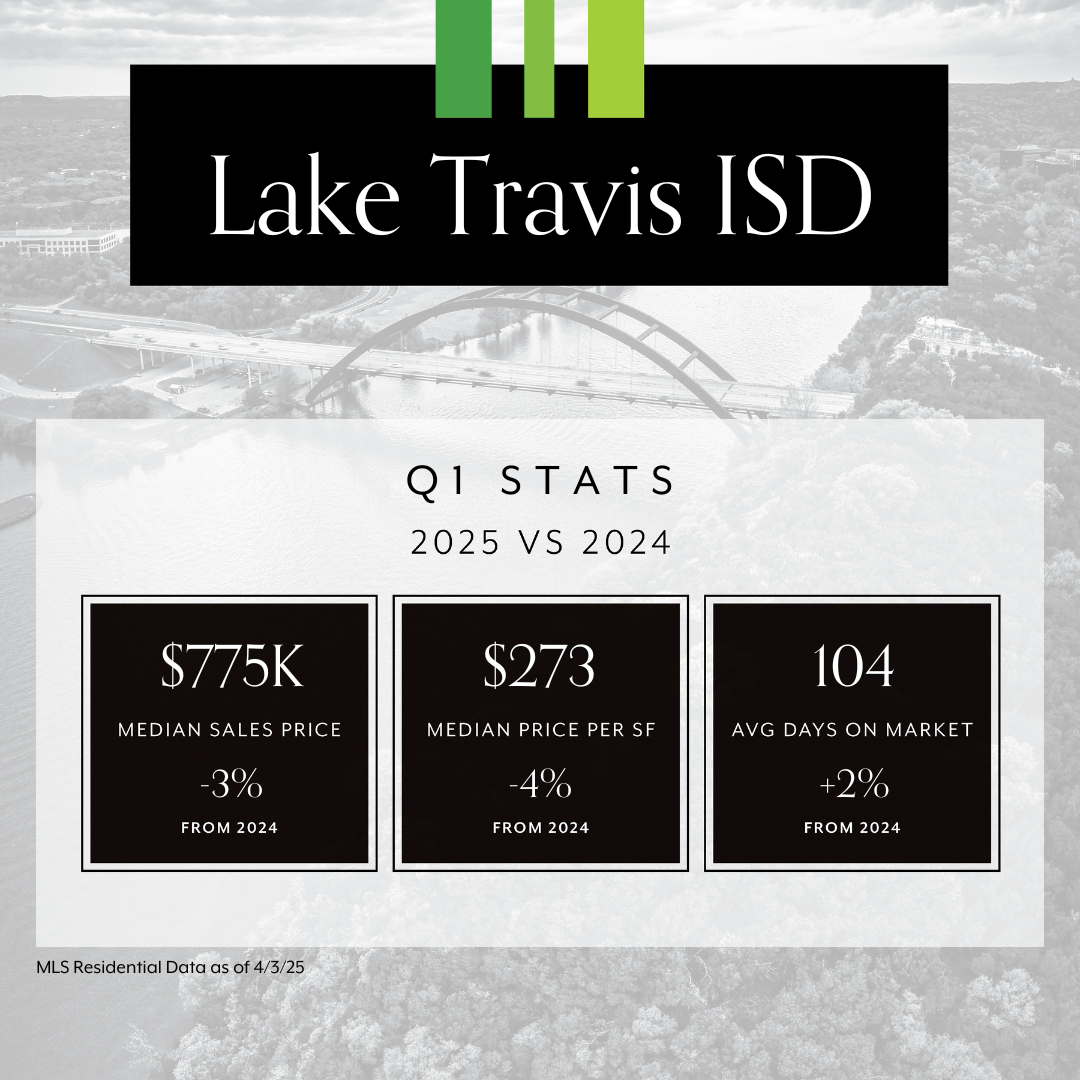
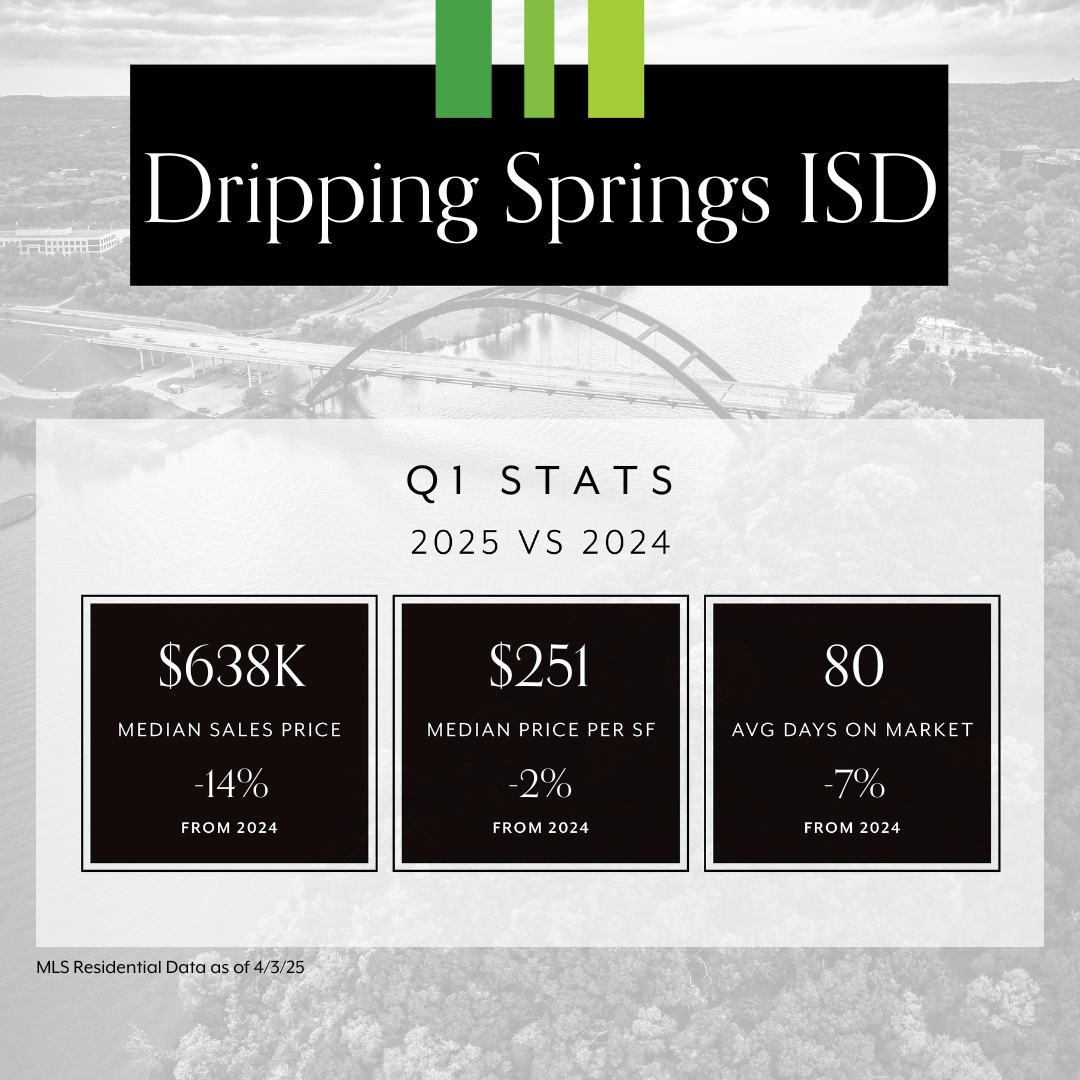
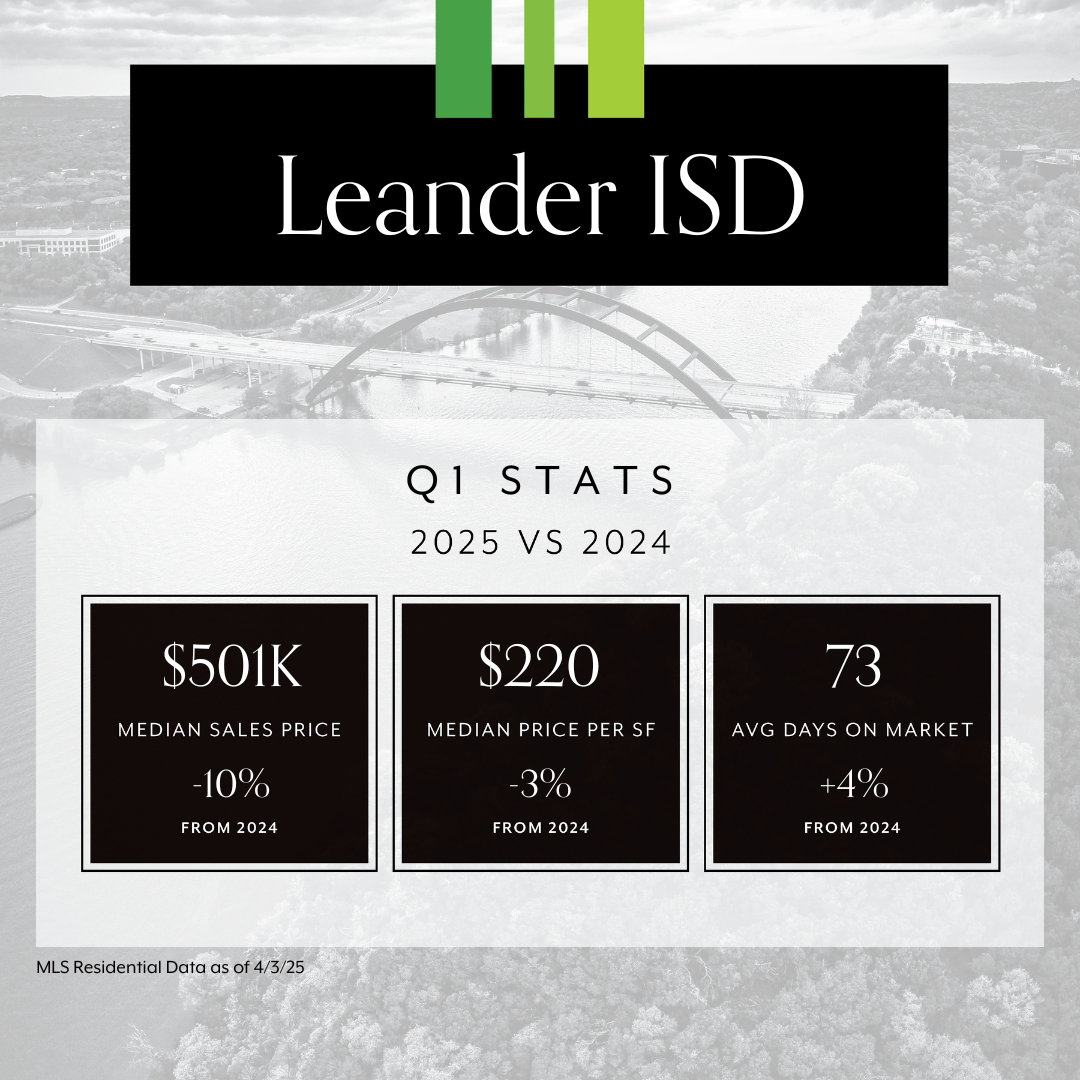
Scroll below to view Austin and surrounding area statistics.

Austin Q1 Stats 2025 vs 2024: Median Sales Price $340K (No Change), Median Price per SF $171 (-1%), Avg Days on Market 70 (+9%).

Q1 stats for Downtown: Median sales price $730K (-20%), median price per SF $805 (+4%), avg days on market 126 (+70%).

Lakefront Q1 Stats: 2025 vs 2024 - Median Sales Price: $650K (+2%), Price per SF: $224 (+3%), Avg Days on Market: 73 (+3%).

Q1 stats for Spicewood: Median sales price $739K (-17%), median price per SF $273 (-10%), avg days on market 125 (-13%).

Infographic showing Q1 real estate stats for 2025 vs 2024: $1.38M median sales price, $380 median price per SF, 76 avg days on market.

Q1 real estate stats for 78703: Median sales price $1.31M (-10%), price per SF $624 (-5%), avg days on market 86 (+34%).

Q1 stats for 78704: Median sales price $852K (+14%), median price per SF $503 (-6%), avg days on market 105 (+25%). Data as of 4/3/25.

Q1 real estate stats for 78734: Median sales price $674K (+5%), price per SF $282 (+1%), avg days on market 97 (+31%).

Q1 stats for 78746: Median sales price $1.88M (+16%), median price per SF $577 (+1%), avg days on market 94 (+13%).

Q1 real estate stats for 78731: Median sales price $995K (-13%), price per SF $458 (no change), avg days on market 69 (+33%).

Q1 stats for 78669: Median sales price $739K (-11%), price per SF $273 (-8%), avg days on market 125 (-13%). Data as of 4/3/25.

Q1 stats for 78738: Median sales price $850K (no change), median price per SF $270 (-4%), avg days on market 104 (-8%).

Q1 stats for Austin ISD: Median sales price $565K (+4%), median price per SF $341 (-3%), avg days on market 77 (+15%).

Eanes ISD Q1 Stats 2025 vs 2024: Median Sales Price $1.66M (+13%), Price per SF $497 (-1%), Avg Days on Market 89 (+33%).

Lake Travis ISD Q1 Stats: 2025 vs 2024 - Median Sales Price: $775K (-3%), Price per SF: $273 (-4%), Avg Days on Market: 104 (+2%).

Lake Travis ISD Q1 Stats: 2025 vs 2024 - Median Sales Price: $775K (-3%), Price per SF: $273 (-4%), Avg Days on Market: 104 (+2%).

Infographic showing Q1 stats for Dripping Springs ISD: Median sales price $638K (-14%), price per SF $251 (-2%), avg days on market 80 (-7%).

Q1 stats for Leander ISD: Median sales price $501K (-10%), price per SF $220 (-3%), avg days on market 73 (+4%).

Work With Greg

Greg connects people to their neighborhoods, to Austin, and to each other—but not necessarily in that order. People are the reason behind his work, and his love of this city makes it a lot of fun. Contact Greg today!

Follow Me on Instagram